Frosts and freezes: As cold as ice…

Facebook

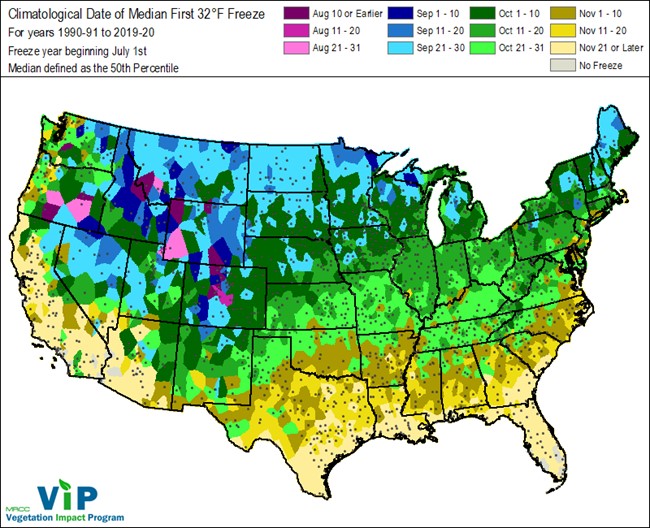
Here in the Southeast we were surprised last week by a much earlier than usual freeze, putting an end to many gardens full of tender plants, although the cold was not deep enough to kill more cold-hardy species. In many parts of the region the frost came earlier than the 10% probability of frost indicating that early freezing conditions like this will come in fewer than one in ten years. Of course many of you in more northern interior parts of the United States have already seen your first frost this year, but here we never seem to be ready for it. In fact in parts of southwest Georgia last year’s first fall frost did not turn out to be until well into January, which caused a lot of problems for gardeners and farmers who had to deal with pests and diseases that easily overwintered the mild conditions.

Map

Description automatically generated
Median date of first 32 F fall frost, from https://www.weather.gov/iwx/fallfrostinfo.

Frost versus freeze

One of the questions I often get this time of year is what is the difference between frost and freeze? The National Weather Service (NWS) puts out both frost and freeze warnings but has different criteria for each. For a frost warning, the predicted temperature may not even get down to 32 F (0 C), but may hover in the mid 30’s. For a freeze warning the predicted temperature is expected to get down to 32 F or below and for a hard or killing freeze it usually gets down to 28 F or lower. Once the area has gotten down to 28 F or lower, the NWS usually stops issuing additional freeze warnings since at that point all but the most cold-hardy plants have completed their growing season and are either dead or dormant.

A close up of a spider web

Description automatically generated with low confidence
Hoar frost on Indian rice grass. Source: NPS Photo by Neal Herbert at Arches National Park via Commons Wikimedia.

How does frost form if the temperature does not get down to freezing?

To understand frost formation and when warnings are issued it helps to know both how frost forms and how temperatures vary near the ground. Frost crystals form on surfaces that get down to freezing and have something on the surface that is conducive to seeding crystal formation. This can happen even when the air temperature is above freezing in conditions of light wind and clear skies that allow surfaces to cool to freezing temperatures by emitting heat radiation out to space at night when there is no incoming solar radiation. Conditions for this can occur with temperatures anywhere in the 30s with a reasonable amount of water vapor in the air and as long as the surface (a metal car body, an asphalt roof, or a blade of grass) can cool to the freezing point. At that point, anywhere on that surface that has an appropriate scratch, particle, or other imperfection can serve as a place for ice crystals to form and start to grow. These are called nucleation sites and allow the initial formation of an ice crystal upon which more ice can grow into delicate but visible frost.

Frost will not form if the humidity is too low because there is not enough moisture to produce visible crystals. Often frost does not damage the plants a lot because most of the frozen water is confined to the surface of the plant and does not affect the interior cell walls, although there may certainly be some damage where the ice forms. Large formations of ice crystals can sometimes form on trees or fences if the conditions are right; this is called hoar frost.

Hoar frost on ”Burgbühl” (also Hexenbühl) near Obernheim (Swabian Jura). Source: Olga Ernst, Commons Wikimedia.

Frost forecasts are also provided with the understanding that the NWS is forecasting temperature values for their thermometer heights of about 2 meters or 6 feet high, since that is how they verify the accuracy of their forecasts. In light winds and clear skies the temperature at the ground level is often colder than the temperature at the thermometer height due to cold air sinking so the ground in your garden may be colder than the forecast would predict. Frost is also more likely to form on elevated surfaces that don’t have contact with the ground, since soil temperature keeps the ground surface warmer in Fall than later in the year due to residual heat from the summer warmth. Blueberry farmers that I work with tell me that you can sometimes see quite a difference in frost damage to their bushes from top to bottom due to the different temperatures that the plant may experience at different heights above the ground. Bridges often have signs that they freeze first for the same reason.

A close up of a flower

Description automatically generated with medium confidence
Saucer magnolia with freeze damage. Source: Famartin, Commons Wikimedia.

Freeze damage to garden plants

The NWS issues freeze forecasts when the temperature is expected to get down to or below 32 F. The damage that the freeze does to plants depends on how long the temperature drops below freezing and how susceptible the plant is to cold temperatures. If the temperature barely gets down to 32 F for a short period damage is likely to be minimal since the water inside the plant cells did not have sufficient time to freeze. But if it lasts longer the water in the cells freezes and, as you undoubtedly know, ice expands and breaks the cell walls causing irreversible damage to plant leaves and stems that leads to their death. John Porter provided a useful table of how different garden vegetables respond to cold temperatures in his 2020 blog on spring frosts, which underlines why some vegetables like spinach and cauliflower do better as late-season vegetables than tomatoes and melons.

The discerning reader who looks at John’s article will also note some differences between the first frost map he published in his blog and the map above, because they cover different time periods. John used the map for 1980-81 to 2009-2010, since that was the current one at the time of his post. The map here uses the 1990-91 to 2019-2020 period since the normal temperatures have been updated since John’s blog was published. Average frost dates change over time as you can see especially in some areas like eastern Oregon and northern New York State and generally, as the earth gets warmer, the first frost of fall is occurring later in the year than it did in the past (although there are a few exceptions such as parts of northern Georgia).

Frosted Kale. Source: Tracy from North Brookfield, Massachusetts, USA, Commons Wikimedia

With winter on the way, we are sure to see many more examples of frosts and freezes in the coming weeks for almost everyone other than those who live in tropical areas. For those of us who enjoy chilly weather, the magic of frosts and freezes is something we look forward to as it paints our dying gardens in icy white.

Facebook

Predicting hurricane tracks and what they leave behind

Facebook

In my last blog post in late August, the Atlantic tropical season was just beginning to wake from a long nap, with several areas of interest appearing on the National Hurricane Center’s (NHC) map. Since that time, the season has become incredibly active, with Hurricanes Fiona and Ian causing tremendous damage in North America. Other parts of the world have also seen damaging storms, including Hurricane Kay in the Eastern Pacific, post-typhoon Merbok in Alaska, and Typhoons Hinnamnor in South Korea, Nanmadol in Japan, and Noru in the Philippines. So, with apologies to those who live far from hurricane parts of the world, I want to talk one more time about tropical systems.

Heavy rain. Source: Faldrian, Commons Wikimedia

Where do we stand with the tropical season now?

As I am writing this on Thursday morning, September 29, I hear the sound of Ian’s wind in the tulip poplar trees outside my house in Athens, GA. Ian is still in central Florida, just about to come off the coast into the Atlantic Ocean, so that gives you an idea of how far the influence of a tropical storm can spread, especially with a strong high-pressure center to our north that is increasing the pressure gradient driving the winds. Ian made landfall yesterday afternoon near Fort Myers, Florida, as an almost-category 5 storm, with winds of 150 mph (some reports say 155 mph). The videos I saw yesterday showed the power of the storm, with tremendous wind gusts and a storm surge that surpassed 10 feet in some places. I know the damage is horrific, and some of those areas will never recover completely from the storm, as buildings have been washed away and even shorelines may have changed due to the force of the wind and water. Since Ian is expected to curve back toward the East Coast on Friday and may strengthen again, its effects are not over yet. Fortunately, a weaker storm has lower impacts, but folks along the Georgia and South Carolina coasts will be feeling those impacts in the next few days before Ian moves out of the area and dissipates.

Hurricane Ian, September 27, 2002.

Hurricane Fiona lashed Puerto Rico and the Dominican Republic with rain of up to two feet in some places around September 18-19 before moving rapidly to the north and slamming into Nova Scotia as a post-tropical cyclone on September 24. It caused tremendous damage in both places from storm surge, wind, and rains. The floods in Puerto Rico destroyed a lot of local farms and gardens in the southern half of the islands where the rain was heaviest and in doing so, eliminated an important source of locally produced food as well as disabling a fragile power grid that had not yet recovered from Hurricane Maria in 2017. The storms in other parts of the world have had similarly bad effects on the lands over which they moved, with loss of trees and buildings and high storm surges wiping out coastal infrastructure. Not all hurricane impacts are bad, however, since the rain from Hurricane Kay in southern California helped reduce drought conditions there in a time when not much rain usually falls in that part of the world.

Predicting the tracks of hurricanes

One of the questions that have arisen with Hurricane Ian has been the prediction of where the hurricane would go. Predicting the track of a hurricane is an art that includes the use of multiple computer models that simulate conditions over the life of the storm. That includes sea surface temperature, vertical atmospheric structure, and the surrounding wind field which will push the storm around. On the news you will often see maps that show all the individual model results on one map, which ends up looking like a mass of spaghetti noodles, hence the term “spaghetti models”.

Ensemble of Hurricane Ian forecasts from the GEFS model issued on September 26, 2022. Source: WeatherNerds.org

Forecasters look at all the individual model tracks together to see how consistent they are with each other and where the differences lie. Then the human forecasters use their knowledge of how well those models behave under different weather conditions to create a “forecast cone” that shows the region where the center of the storm is likely to go.

No one model is right all the time because they weigh different weather factors differently. In the case of Ian, the models run by European weather services did better, but that is not always the case. Generally, they say that 2/3rd of the time, the central low pressure will stay within the predicted cone, although the storm itself is usually much larger than the cone and hazards like high wind, heavy rain, tornadoes, and storm surge can and do occur far outside the cone. If there is a lot of spread in the models, then the forecast cone is wider, indicating that they are less certain about where the storm will go.

The models are run every six hours or so, and each time the cone is updated to include model results that include new weather data observed since the last forecast was issued. As this happens, people that are in or near the cone must respond to the forecast by deciding whether to evacuate or stay in place and where to go if they do leave, since they don’t want to evacuate to a location that could be hit by the storm if the cone shifts. When the forecast is especially tricky, as it was with Ian, the movement of the cone over time can become overwhelming to people who just want to find a place they will be safe. The forecasts of where the storm is likely to travel are improving over time, but the tracks will never be 100% accurate because the atmosphere is a complicated place that we can’t simulate perfectly using even the best computers, so confusion is likely to continue to occur in future storms.

Downed trees and powerlines in Bartow, FL, following Hurricane Ian. Source: State Farm, Commons Wikimedia.

Dealing with flooded gardens

Since this is a blog about gardening, I want to end up mentioning what impacts these storms have on gardens. Coastal areas where there is a storm surge will see inches to feet of seawater flow over their land. The water contains salt but can also contain toxic chemicals from boats and tanks that are damaged by floating debris or strong waves. The salt and chemicals can kill garden plants but also may get deposited in the soil as the water sinks in, leaving toxic residue behind. The physical motion of the water on and off the land can also scour the topsoil and change the soil structure or deposit sand on top. Saturated soils can drown the plants by keeping oxygen from reaching the roots of plants. And of course, the howling winds can snap the plants, bushes, and trees above the ground, leading to damage that can be taken advantage of by pests and diseases. In areas where there is heavy rain and freshwater flooding, salt is not usually a problem, but all the other problems with too much water can occur there, too. For those who live where storm damage is heaviest, helping their gardens to recover will be a long process even if their houses survive the storm.

Hurricane Ian clouds at sunset. Source: Jason Mallard.

The Atlantic tropical season is not over yet for us in the Southeast, but I know that in other parts of the United States and the world, the seasons march on, so in the next months I will move on to talk about fall frosts and the upcoming winter. Thanks for bearing with me as I explore tropical storm systems. Please keep all of those affected by our storms this year in your thoughts and prayers as they work to recover from damage and disaster.

Facebook

The 2022 Tropical Season: It’s Alive!

Facebook

In my last blog post in early August, I noted how quiet the Atlantic tropical season has been so far this year. In fact, the period from early July through this week has been one of the quietest on record, with no named storms since the short-lived Tropical Storm Colin formed along the South Carolina coast and dissipated less than 24 hours later on July 3 in eastern North Carolina. The last time we had so few named storms was 40 years ago, so while it is not unprecedented, it is certainly unusual. And we are definitely later than the average date for the first hurricane of the year. By comparison, in 1992, a strong El Niño year, Hurricane Andrew (an “A” storm, so the first of the year) had formed and taken its devastating track through southern Florida and Louisiana by this date.

Atlantic 5-day outlook on 8-28-2022

All of that is about to change, and hurricane forecasters are relieved after predicting a season of above-normal activity based on warm ocean temperatures and the current strong La Niña. They could still be correct. The National Hurricane Center’s 5-day map (as of 8-28-2022) is now showing four areas of potential development, with one area that has a 50% chance of development into a tropical depression within the next 5 days. Just in time for the peak of the season, according to the timeline we discussed earlier this month.

Why have the tropics been so quiet?

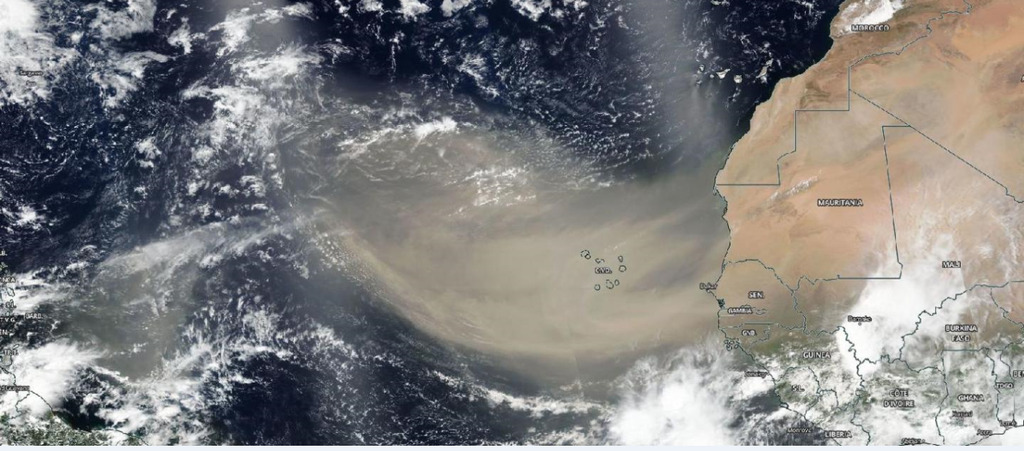
What caused the very quiet period in July and August? Hurricane climatologists point to several factors: the continuing clouds of dust that have blown off Africa and across the Atlantic Ocean towards the west, dry air moving in from Europe, which is experiencing its worst drought in 500 years, and the lack of strong waves moving off of Africa to act as seeds for tropical storm development. But the presence of warm sea surface temperatures and the lack of a strong jet stream (which is consistent with the presence of the La Niña) were expected to contribute to a stronger season than we have seen so far. If we can’t understand why this season has been so quiet so far, it means we still have a lot to learn about hurricane climatology and behavior.

A large storm in the ocean

Description automatically generated with low confidence
Tropical Storm Lisa on September 23, 2016 with African dust

The second half of the 2022 season is likely to be a lot more active than the first half, although forecasters have dropped the predicted number of storms from the early forecast due to the past two quiet months. If you live in an area affected by Atlantic hurricanes, you should be prepared for a more active pattern—don’t let the last two months fool you! If you live in another part of the world that is affected by tropical storms, you should also understand their climatology and likely impacts on where you are as well.

A body of water with a sunset

Description automatically generated with low confidence
Caribbean rain shower at Man-of-War Bay, Tobago, September 1980. Source: NOAA.

Some resources for following hurricane weather

For those of you who are fascinated by tropical storms and hurricanes, even if you don’t live in an area that is prone to them, there are a few resources that you can use to track potential storms and follow them as they develop and move through areas that could be severely impacted by them. The first site I use is the National Hurricane Center, the source of official forecasts and outlooks for the season as well as specific storms as they form. Their website has a lot of information about past storms as well as educational resources on tropical systems. You can also find a lot of maps and climatological information at Mike’s Weather Page if you just need a quick look at maps and other images related to tropical weather in the Atlantic and Pacific Basins.

On social media, I follow Bryan Norcross and Brian McNoldy on Facebook and Twitter; they may be on other social media as well. Bryan Norcross is the television meteorologist who was working in Miami at the time of Hurricane Andrew; it has been fascinating this week to follow his timeline of Andrew from tiny disturbance to monster storm as it hit Miami and then Louisiana over the past week back in 1992, thirty years ago. Brian McNoldy is a senior hurricane researcher who works at the University of Miami and has done some interesting climatological work on past hurricanes as well as provides insight on the current season. There are also plenty of great local resources for local impacts if you live in a hurricane-prone area.

A picture containing nature

Description automatically generated
Landfall of Hurricane Michael, October 10, 2018 from earth.nullschool.net

How to visualize the wind

If you are interested in looking at the wind patterns associated with storms, both tropical and extra-tropical, then there are three sources of fascinating maps that allow you to visualize the flow of air across the United States or the world:

United States current surface winds Hint.fm/wind. This site has a current map of the surface winds across the continental United States showing the wind speed and direction in motion. It is based on a near-real-time computer simulation to provide seamless coverage across the country.

Global earth interactive wind map https://earth.nullschool.net/. This interactive map allows you to look at current winds anywhere on the earth by dragging and zooming on the globe. You can use the menu on the lower left to pick higher levels in the atmosphere; this will allow you to look at jet streams aloft as well as surface winds.

Windy global current and forecast winds https://www.windy.com/. This site provides global current and forecast winds as well as other weather information that will allow you to view the weather and plan for future weather conditions at home or away.

These sites provide you with information about both wind speed and direction. That can be very useful for gardeners who are spraying or need wind information to track where the air hitting their gardens has come from. Wind drift of agricultural chemicals also causes damage to crops and outdoor workers. Exposure to chemicals such as weed killers can affect gardens adversely, and it can be important to know where those chemicals are coming from. If you don’t have access to local wind observations, these maps can provide you with useful information.

Facebook

The 2022 Tropical Season: What are Tropical Systems?

Facebook

In the Southeast, almost nothing gets more press than the Atlantic Tropical Season, including the outlooks, real-time events, and post-storm analyses. If you live in another part of the United States or the world, you may not be as directly affected as the Southeast is, but you might be surprised at how far and wide tropical moisture is spread, either directly by tropical storms and hurricanes or by the remnant moisture which can be carried with the winds for long distances away from their original sources. This week I will describe what tropical systems are and what they mean for gardeners. In my next post, I will review the current season, including any impacts that have occurred. Don’t let the early quiet conditions fool you—about 90% of Atlantic tropical activity occurs from mid-August through mid-October.

Hurricane lily (Lycoris radiata var. radiate). Source: Tonbu Mizo, Commons Wikimedia. For why they are called “hurricane lilies”, visit https://gardeningsolutions.ifas.ufl.edu/plants/ornamentals/hurricane-lily.html.

What is a tropical system?

I am using “tropical system” as a term that encompasses the life cycle of a tropical disturbance from birth to death. That may include formation by a tropical wave coming off Africa, developing in the Gulf of Mexico, or growing in the Eastern Pacific Ocean, then a tropical storm, a hurricane (maybe even a major one), and eventually a slow death as a tropical depression or extra-tropical low that has lost its tropical characteristics.

The map below shows historical tracks for all known storms across the globe. Note that in some regions they are called hurricanes and others, typhoons, but both are tropical cyclones, the generic name for rotating, organized systems of thunderstorms that originate over tropical waters and have closed, low-level circulations. The pattern of tracks shows some interesting information about tropical systems. For example, why are there almost no tracks in the eastern part of the South Pacific Ocean or in the southern Atlantic? Why do many of the tracks show a curve as the storm moves from east to west? Why are there more storms in the Northern Hemisphere (NH) than in the Southern (SH)? Why are there almost no tracks along the equator?

A picture containing nature

Description automatically generated
Historical tropical storm tracks. Color coding indicates tropical depressions (green), tropical storms (yellow), hurricanes (red), and post-tropical storms (gray).

What ingredients are needed for tropical systems to develop?

Tropical systems form from areas of low pressure that develop rotation (counterclockwise in the NH and clockwise in the SH) as the storms’ pressure decreases. For the storm to strengthen, it needs favorable conditions to cause rising air in the center, which drops the pressure at the surface. One ingredient is ocean surface temperature of 80 F or higher (27 C)—that explains why almost no storms develop in the southeastern Pacific or southern Atlantic, since both are far too cold. Tropical storms and hurricanes are considered to be “warm core” systems with the air in the center of the storm staying warm all the way to the top of the circulation. The peak season of storms in the Atlantic is related to the cycle of ocean temperatures, with the highest likelihood of storms in the period from mid-August to mid-October. As ocean temperatures warm, this could mean a shift in hurricane season in the future.

For spin to develop, you need a force called the Coriolis force that affects the atmosphere due to the earth’s rotation around its axis. The Coriolis force is zero at the equator so any areas of low pressure that form in that area can’t develop the necessary spin to form storms. Another ingredient is light winds higher up in the atmosphere. This allows the vertical structure of the storm to develop a strong circulation that ultimately becomes a hurricane. This becomes important when we talk about the impacts of El Nino and La Nina on predictions of tropical seasons, since El Nino years have much stronger jet streams in tropical regions than La Nina or neutral conditions do.

The curvature of the tracks is due to the mid-level winds in the atmosphere that steer the storms as they go through their life cycles. The counterclockwise flow of air around ridges of high pressure systems push the storms along their edges. This often results in a C-shaped pattern as the storm travels around the western edge of the oceanic high pressure, although the position and strength of the high pressure will help determine the path each storm takes and when or if it recurves to the northeast.

Depiction of a hurricane life cycle, from a tropical disturbance (easterly wave off the West coast of Africa) to a fully formed hurricane. Image credit: NOAA/NHC.

Impacts of tropical systems

Some impacts of tropical systems are only found near the center of the circulation, but others can be found hundreds of miles away, so even if you are not in the main area that tropical storms affect, you are not without risk. These storms are not small whirls like tornadoes, but are much bigger and can take hours to cross a location near the center. If you are close to the storm’s center, especially if you are on the right side of the storm’s path, you are likely to experience strong winds, heavy rain, and, if you are near the coast, the chance of a storm surge coming inland from the ocean. Farther away, you can experience strong squalls that include small tornadoes, heavy rains, and gusty winds. These effects are made worse if you live in mountainous areas where lifted air can cause rapid flooding conditions. Some of the worst floods in U. S. history are from former hurricanes that traveled over mountains and dropped incredible amounts of rain, such as Agnes, which caused the death of 122 people mostly in Pennsylvania, almost exactly 50 years ago.

Even after a storm weakens to a depression or transforms into an extra-tropical storm, the blob of moisture within the remains of the storm can be transported by the atmospheric circulation a long ways. There have been records of typhoons in the Western Pacific Ocean whose watery remains crossed the ocean and brought heavy rain to the West Coast. Occasionally some will enter the central United States and drop flooding rain there, too, such as the remains of Tropical Storm Erin in 2007.

Hurricane Dennis batters palm trees and floods parts of Naval Air Station (NAS) Key West’s Truman Annex, U.S. Navy photo by Jim Brooks

What gardeners (and everyone else) should know

Preparing a garden for a hurricane is no different than preparing for other types of extreme weather. Survey your property before the season to make sure that no objects that could blow around in high winds damaged are present. If a storm is coming, make sure that your yard is free of garden gnomes, rakes, damaged tree limbs, or other loose objects that could become airborne. Make sure your roofs and gutters can shed heavy rain and have a place on your property to contain rainwater safely. Have supplies of batteries, non-perishable food, and water for people and pets. Put together a plan to recover later by making inventories of your property, including outdoor equipment that you store online. And make a family plan for how to evacuate if you live in an area of flooding and how to contact each other later if you get separated. Cell phones often do not work after strong wind events, so you can’t count on them to bring your family back together quickly after a storm.

What’s next?

I expect to see the Atlantic tropical season start to pick up by mid-August, when the African dust that is currently inhibiting storm formation clears and the ocean temperatures get even warmer. In fact, today’s 5-day outlook map shows an area of possible development in the eastern Atlantic (as of 8-6-2022). This is expected to be another active season, and even though we’ve only had three named storms so far, we will likely see many more storms before the end of November, when the official season ends. In my next blog, we will look at the season so far in more detail.

Facebook

How monsoons affect gardens

Facebook

“Some people feel the rain. Others just get wet.”—Bob Marley

If you follow the weather news carefully, you might have noticed a little factoid in this week’s headlines: Mawsynram, Meghalaya, in northeastern India reported the highest all-time single-day rainfall in the month of June on the 17th. At 1,003.6 mm (39.5 inches), it eclipsed the previous highest rainfall of 945.4 mm (37.2 inches) recorded on June 7, 1966, according to the Guwahati-based Regional Meteorological Centre (RMC). The extraordinary rain fell as part of the Indian monsoon while other parts of the country are in drought and have received less rain than usual so far, although monsoon rains have been picking up. Seventy percent of India’s rain comes from the monsoon so if the monsoon fails, agriculture and water supplies are severely impacted.

A group of trees with clouds in the background

Description automatically generated with low confidence
Monsoon clouds in Himalayas. Source: Sitikantha kheti, Commons Wikimedia, 20 March 2018

What is a monsoon?

If you ask a layperson what a monsoon is, they will probably tell you something about very heavy rain and might even mention that it is a seasonal rain event. The most famous monsoon occurs in India each year, but monsoons are found in other parts of the world as well including China, Africa, and the United States. In the U. S., the Southwest Monsoon season usually starts in mid-June. If you look at the weather forecasts this week, it is right on time. This period is characterized by heavy showers and strong moisture flowing into the region bringing wet conditions to areas of the country that seldom see rain in other seasons. But officially, a monsoon is not the rain itself but a change in the atmospheric flow driven by differences in land-sea heating in summer. Rain falls in one half of the cycle but the switch to the opposite flow pattern often means dry weather as high pressure forces moist air away from the land.

Map

Description automatically generated
7-day predicted rainfall on June 19, 2022, from NOAA.

How a monsoon forms

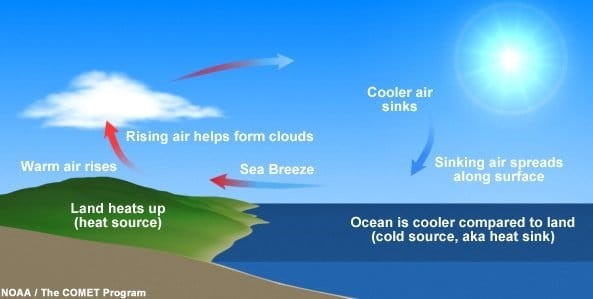
Monsoons are driven by temperature differences between land and water caused by heating from the sun. The hot land causes air over it to rise, leading to a net low-pressure area. Air rushes in from other locations to even out the pressure. On a small scale this type of circulation occurs as a sea breeze that you might feel along the shores of a large lake or ocean. The land heats up much more quickly than the water during the day, causing rising air over land that creates a circulating cell of air that blows cooler air from water to land in afternoon when the temperature difference is strongest. You can often feel a sea breeze front as the cooler air moves inland, and sometimes thunderstorms form along that boundary between land and marine air masses.

Diagram

Description automatically generated
This diagram shows how seasonal temperature differences between the land and ocean can create the right conditions for a monsoon. Credit: NASA/JPL-Caltech

In a monsoon this pattern happens on a much larger scale. In Southeast Asia, for example, the whole of India and surrounding countries heats up under the direct summer sun much more than the Indian Ocean to the south. That causes air to rise over the land and pulls in air from the ocean to the south. In India, meteorologists track the progression of the monsoon “front” from south to north across the region and celebrate when the monsoon finally arrives, bringing copious showers that bring much-needed rain to India. In the Southwest U. S., the coming of the monsoon is also watched carefully because it provides welcome moisture and cooler temperatures to the region due to increased cloud cover. More than 50% of the annual rainfall of Arizona and New Mexico falls during the Southwest monsoon, so it is an essential part of the seasonal cycle. But it can also bring lightning strikes that spark forest fires in areas that receive little rain, causing widespread destruction in those areas.

Diagram

Description automatically generated
During typical conditions in the spring, the U.S. Southwest experiences strong, dry winds blowing from the west. During a summer monsoon, the region experiences winds from the south, which carry moisture from the Pacific Ocean and the Gulf of California. This can cause heavy rainfall and thunderstorms. Credit: NASA/JPL-Caltech

How monsoons are important to gardeners

If you live in a part of the world that is affected by monsoons, you need to be prepared for the variation of rain over the course of the year. During the wet part of the monsoon, you may experience very heavy rains that can erode your garden and wash out plants. If you have low-lying areas, roots can be affected by standing water to the detriment of your garden plants unless you put in good drainage. Conversely, you need to also be prepared for periods with little to no rain at all, sometimes for significant periods of time. That means you either need to use plants that are adapted to the wet-and-dry monsoon conditions or be prepared to irrigate them regularly to keep them in good shape.

A tree with lightning in the background

Description automatically generated with low confidence
Rain in Mohave Desert. Source: Jessie Eastland, Commons Wikimedia.

Monsoons are one example of how earth’s geography, including sun angle, land-sea distribution, and differential heating all work together to create diverse climates across the globe. They have inspired local music and literature as essential elements of culture in India and other parts of the world. And they serve as a critical driver of plant life by providing needed moisture to growing plants and crops. So for those of you who live in monsoon climates, do a little dance when the rains begin. The monsoon is here!

Other resources:

British Meteorological Office video: What is a monsoon?

NOAA SciJinks: What is a monsoon

Monsoon video series of SW monsoon imagery set to music by Mike Olbinski—spectacular!

Chasing the Monsoon: A Modern Pilgrimage through India—my favorite book on tracking the monsoon through India

Facebook

Monitoring and reporting on drought conditions

Facebook

While drought is part of the natural cycle of the climate and many native plants depend on drought to propagate, it is the bane of gardeners everywhere because of the increased need for water. I have previously written about the four types of drought. Today I thought I would focus on drought monitoring and a way that you, as a citizen scientist, can help report local conditions that the official drought monitor authors can use to fine-tune their depictions of drought. This will be especially helpful this year with so much of the country in drought conditions.

A picture containing sky, outdoor, water, nature

Description automatically generated
Desert bounty. Source: GTGallop, Commons Wikimedia

What is the Drought Monitor?

The U. S. Drought Monitor (I’ll call it the DM here) is the source of the “official” drought status across the country. Of course, you don’t need an official status to be in drought but it is commonly used by media, government agencies, and scientists to categorize the strength of drought over time and space. The official DM map shows a single map for the United States updated each Thursday morning that is color-coded by five levels of dry conditions ranging from Abnormally Dry (D0) to Exceptional Drought (D4). The drought categories show experts’ assessments of conditions related to dryness and drought including observations of how much water is available in streams, lakes, and soils compared to usual for the same time of year. If there is no color shown then that region is not officially in drought. If it is in D0 (bright yellow on the map), then it is considered dry but not currently in drought. Often a D0 designation means either that drought is imminent or that there are lingering impacts from a drought that is ending. You can read more details about what kinds of impacts are seen in each level of drought and how the weekly map is produced on their “About” page. You can also find links to state-specific impacts there, since a drought in the Southeast does not look like a drought in the Southwest, for example.

National Drought Monitor map for May 24, 2022.

Issues with the DM

One of the shortcomings of the DM is that there is just one weekly map that is supposed to be a complete depiction of drought across the United States. If you read my last post on drought, you know that drought comes in different varieties that occur over different time periods. Agricultural droughts are caused by dry spells and hot temperatures during the growing season and can come on very quickly (“flash droughts”), while the long-term precipitation averages might not reflect that lack of water and so would not be captured on the DM map. Hydrological drought is related to a long-term lack of rainfall that reduces the water levels of lakes, streams, and reservoirs over many months or even years. It might not affect gardens and farms significantly as long as enough rain falls at regular intervals to keep the plants alive.

While the DM was not created to be a legal means for defining drought, it has become one in legislation passed by Congress to provide drought relief to affected farmers. The program I deal with the most in my work is the Livestock Forage Disaster Program, which provides a payment to forage producers to offset economic losses if drought stops the growth of pastures, especially early in spring when hay supplies are depleted over the winter. The law is written in such a way that if the drought level is severe drought or worse (D2+) for eight consecutive weeks, then they can receive one month’s payment for the lost forage. If it is in extreme drought (D3) somewhere in their county for any time during the growing season, then they can get payment for three months.

Dry pasture in Oglethorpe County, GA. CMOR report by BWF, May 2022.

As you can imagine, when a flash drought happens and the grass stops growing the forage producers need the relief to help purchase hay to keep their livestock alive. But the DM does not typically depict this quick-changing drought because it is based on longer-term indicators that do not change much over just a couple of weeks. So there is a disconnect between what the DM is showing and how it is being used for legal purposes, at least in the case of forage and pastures.

As you might guess, this results in some attempts to game the system to make it look drier than it is to get the DM authors to declare a D2 or higher drought. The authors tell stories about being harassed over the phone about where they draw the drought lines on the map, finding observers who report no rain when radar clearly showed it occurred, and other creative ways to make the drought appear worse than it is so they can get access to the payments they need.

How can you monitor and report drought?

Here is where you come in: Citizens like you have an important role to play in keeping an eye on local vegetation and monitoring it for signs of drought or impacts from saturated soil. Gardeners are already especially attuned to what conditions are normal and what conditions are not. Folks who monitor local climate conditions are much like storm spotters who monitor weather systems for strong winds and tornadoes—they watch how things evolve over time and provide that information to the authors of the DM and others who need hyper-local information, although on a much longer time-scale that storm spotters. If you are a CoCoRaHS rainfall observer, you probably already know about the Condition Monitoring report that you can submit through their website. Another great place anyone can submit official Condition Monitoring Reports (called CMOR which is pronounced “see more”) is the CMOR site on Drought.gov.

Condition Monitoring Reports for the 30-day period ending on May 24, 2022.

As you can see from the map above, there are many parts of the country with no CMOR reports to provide information about conditions at those spots. By providing these reports, you are helping the DM authors with unbiased, fact-based local observations that can support other drought indicators like streamflow, precipitation deficits, and groundwater losses. Thanks for providing this service to the DM authors and other scientists!

A picture containing grass, outdoor, sky, nature

Description automatically generated
Lake Powell, Desert Flowers. Source: Don Graham, Commons Wikimedia. He says: “What’s left of Lake Powell is between this stand of wildflowers and the buttes in the distance. It is, sadly, more like a pond now than like a lake.” Even the desert can be in a drought if the rainfall is much less than expected!

Facebook

What a third year of La Niña means for gardens

Facebook

NOAA recently announced that La Niña is favored to continue through summer and fall this year and could last through next spring. This forecast is bound to strike fear in gardeners in the western United States, since La Niña is associated with drought in the western parts of the country which sorely needs more rain. Los Angeles has announced some stringent watering restrictions due to impending water shortages, and that means gardeners will have to be especially careful there to use the water they have wisely.

Los Angeles Air Force Base uses xeriscaping to conserve water. Source: AF_SMC., Commons Wikimedia.

What is La Niña?

Many people have heard the terms La Niña and El Niño but for those who don’t, let me take a few minutes to describe them. You can also read more in my blog post from last fall when this winter’s La Niña was just getting going. El Niño and La Niña are two opposite phases of an oscillation in the atmosphere and ocean in the Eastern Pacific, with neutral conditions in between the two phases as the oscillation swings back and forth like a seesaw. When that region’s sea surface temperature is warmer than usual near the equator, rising air above the warm water creates thunderstorms which act like a rock in a river diverting the flow of air along the southern US, especially in winter when El Niño and La Niña are usually strongest.

Source: NOAA.

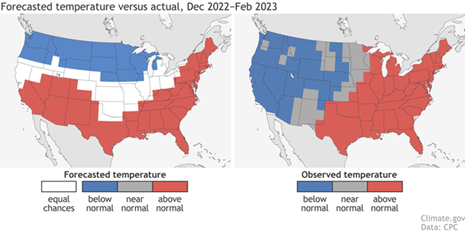
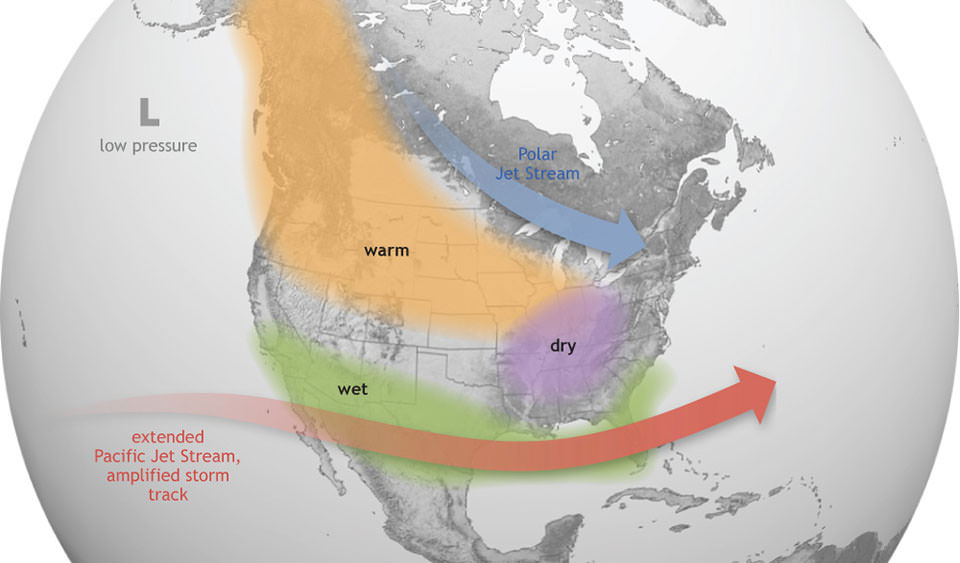
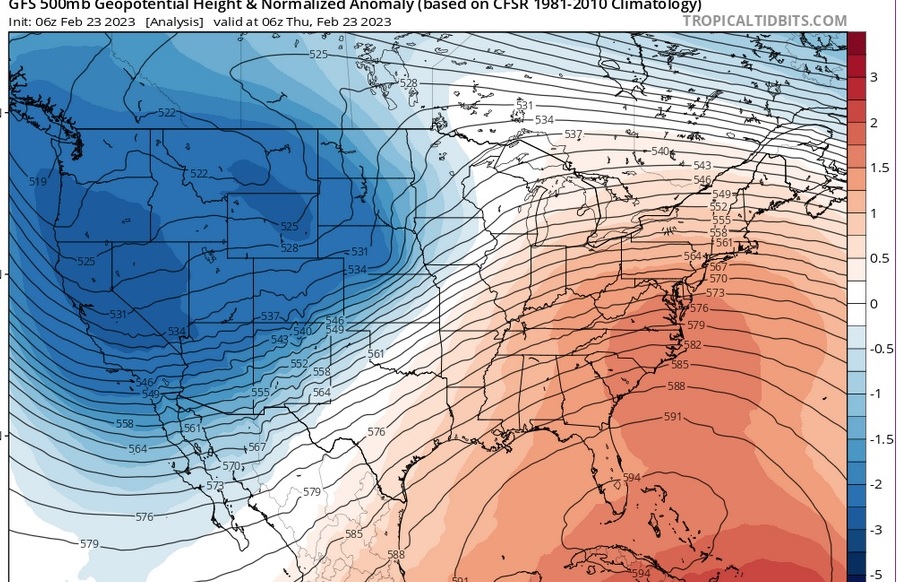
In El Niño winters, the Southeast is usually wetter and cooler than usual due to the presence of the subtropical jet stream overhead. It pushes storms with their associated rain and cloudy conditions through the region, recharging soil moisture for the next growing season. In La Niña winters, the jet stream is shifted to the north over the Ohio River Valley, leaving the Southeast warm, dry, and sunny. That means conditions for severe weather are more favorable in the Southeast than in other phases; we have certainly seen plenty of that this year so far. The lack of a strong jet stream also means that tropical activity in the Atlantic Ocean is more frequent and stronger than in El Niño years. In northern parts of the country La Niña winters are usually cold and snowy with a late start to spring, as we have seen this year. The Pacific Northwest is often wet, which also matches what has occurred in their coastal areas this year.

The ENSO Index shows El Niño periods as positive values (in red for warm Eastern Pacific ocean temperatures) and La Niña periods as negative values (in blue for cold ocean temperatures). Index values between +0.5 and -0.5 are considered neutral and are highlighted with gray.

How often does a third year of La Niña occur?

The atmosphere usually swings back and forth between El Niño and La Niña roughly every 3-5 years. Right now we are ending a second consecutive winter of La Niña; with its predicted continuation, that would make it three years in a row. This is not unprecedented, but it is certainly unusual, since 1950 we have only had two “triple-dip” La Niñas. Since there are so few direct comparisons it can be hard to determine exactly what to expect this growing season and on into fall and winter. Our best bet is to assume that typical La Niña conditions will occur. The 3-month composites of the expected anomalies (differences from average; MAM means March-April-May, etc.) show the seasonal variability of El Niño and La Niña for temperature and precipitation across the US. La Niña and El Niño’s effects stretch far beyond the US and affect global weather patterns.

What does this mean for the growing season across the United States?

Typically effects from a La Niña are weakest in the summer because sea surface temperature anomalies are not strong and is often switching from La Niña through neutral conditions to an El Niño the next year. However this year the La Niña is still going strong, so this seems less likely. That means the pattern of warm and dry southern states are likely to continue, which is trouble for the already drought-ridden Southwest including California (where severe water restrictions are now in place). With the high temperatures, low rainfall, and low humidity, that means water stress on gardens will be higher than normal, and drought and wildfires could dominate that part of the country for the next few months.

In the Southeast, the active spring severe weather season will likely give way to an active tropical season in summer and fall. Rainfall in the Southeast in summer is dominated by tropical systems and small-scale convective rain events that provide only hit-or-miss rain. If you are in the path of a tropical storm, you can experience several inches of rain while areas a few counties away can see none, resulting in a feast or famine of rain. In the Pacific Northwest wet conditions in coastal areas will give way to drier conditions in the summer but may return again in the fall, while inland areas may continue to see very dry conditions that will lead to increasing drought and water shortages. The Northeast could see wetter than normal conditions so a drought there this year seems unlikely. The central part of the United States could be the hardest hit by drought conditions and the drought that is already present across a large part of the central and western US is likely to get worse over the next few months with little rain expected. That will affect not only gardeners but the farmers of the main grain-growing area of the US, at a time when Ukraine, normally a big grain producer, is not likely to be able to produce a regular crop this year because of the ongoing war.

Source: Walter Siegmund. http://commons.wikimedia.org/wiki/File:Eschscholzia_californica_7717.JPG

Managing your garden in La Niña

Gardeners in the Southwestern US will have the most difficult conditions to manage this year due to the water restrictions and ongoing drought there. Proper use of irrigation and conserving soil moisture through mulch and appropriate choice of plants are good ways to keep water use lower. This may also be true of gardeners in the central US, where the drought could also be severe this summer. In the Southeast, the summer rain you get will depend on tropical activity and where the storms go so you could see either wet or dry conditions. Managing your garden for both dry periods and potentially heavy rains is a challenge that you may need to deal with this year. In the Northeast, the climate may be easier to contend with this year but even short-term dryness can be a problem for plants that need regular infusions of water. In the Pacific Northwest, predictions for a warmer and drier than usual summer mean you should pay careful attention to water-conserving measures, especially in inland areas where drought is already a problem. If you are outside the US, then make sure you understand how La Niña is likely to affect your region and manage your garden accordingly.

Facebook

Measuring the weather in your garden

Facebook

I started writing for The Garden Professors a little over a year ago. My very first posting was on “The weather where you are.” In that article, I described some simple ways to measure the microclimates around your yard using some simple hand instruments. But many of you are already well past that and have your own weather stations. For those of you who don’t, here are some considerations for adding a weather station to your garden and a shameless plug for CoCoRaHS (Community Collaborative Rain Hail and Snow Network), a citizen science network of rainfall (and snowfall!) observers around the United States and Canada as well as a few additional stations in Mexico and the Bahamas. I am the current state CoCoRaHS coordinator for Georgia and we are in the last week of the March Madness competition to sign up new observers that they have every year. Even though this year’s competition ends on March 31 you can sign up and contribute to the precipitation record for your state any time. They have links to purchase their required rain gauge on their website on the bottom right side. They also have a very useful guide for Master Gardeners. If you are not in the United States or neighboring countries, you may be able to find rainfall observing networks in your country that you can join as well.

CoCoRaHS rain gauge. Source: NASA.

Equipment that is used to measure the weather at a location can vary from a very simple thermometer and rain gauge that you can buy at a hardware store to a sophisticated piece of equipment holding multiple sensors that costs thousands of dollars. The research-grade Campbell Scientific stations that we use in the University of Georgia Weather Network cost about $12,000 each, which is well out of reach of most homeowners, but there are plenty of options for weather enthusiasts that are much more reasonable in price.

University of Georgia weather station in Blue Ridge, GA, at Mercier Orchards. Photo: Eddie Edenfield.

A basic weather station may just measure a few variables like temperature and pressure but most people like to add additional sensors like humidity, precipitation, and wind speed and direction. If you are even more ambitious, you might add solar radiation, soil temperature and moisture, and more specialized sensors like leaf wetness. Weather Underground has a useful list of personal weather stations with some details about what sensors each one has, although you will have to click through the links to get pricing. Weather Underground also provides information on how to hook up some of these stations to the web so that you can share your weather information with others and contribute to their own citizen science network.

The single most important factor in getting useful information from your weather station is putting it in a good location. The weather station should be sited where there is good air flow so that you get a representative temperature and humidity for the area. The temperature sensor should also be shaded so that it does not warm up due to direct sunlight. Many stations include an enclosure to shield the thermometer from the sun’s energy. The enclosures are usually white to reflect sunlight and have louvers to let air flow through the enclosure. Some use fans to increase the ventilation of the temperature sensor, especially when winds are light.

Rainfall measurements also require good siting. Precipitation gauges should be placed where they will not feel the effects of any nearby trees or buildings. Usually you need a cone of 45 degrees wide above the top of your rain gauge that does not have any blockage from trees or buildings. Even that may not be enough in all conditions. My own rain gauge is located to the west of my house because that is the only open spot in my tree-filled yard and I notice that in storm systems with wind from the east, the rainfall is lower than other nearby stations because the building is blocking the wind and keeps some of the rain from falling into the gauge. Obviously, you don’t want any moisture from trees, wires, eaves, or fenceposts dripping into the gauge, so look around before you settle on a spot. Dr. Peggy LeMone from the National Center for Atmospheric Research in Colorado described her struggles with making accurate rainfall measurements and why siting is important after a big rain event in 2013.

Rain gauges at Eskdalemuir, Scotland, at the British Geological Survey Magnetic Observatory. The gauges are in pits to cut down on wind effects on the top of the rain gauges.

Rain gauges come in a variety of types. The simplest is a can or tube with vertical walls that you can use to catch rain and measure it at regular intervals (usually once a day at the same time each day for consistency). The CoCoRaHS gauge is a 4-inch diameter plastic tube with a funnel and an inner and outer cylinder that can be easily read to 0.01 inches. It holds up to 11 inches in all, and in some big rain events, it might need to be emptied several times in a day! Many personal weather stations use a tipping bucket rain gauge that has an opening with a funnel that drips the water into a bucket that has two sides on a pivot point. The National Weather Service uses weighing rain gauges to calculate the depth of precipitation based on the weight of the water inside the gauge. The Weather Makers has a good description of how these three types of gauges work as well as illustrations about what they look like. Other newer types of rain gauges include optical gauges that use a photoelectric eye to count water droplets as they pass through a funnel past a light source and haptic gauges that use the sound of raindrops hitting a surface to estimate how much rain has fallen based on the raindrop impacts.

Wind sensors should also be placed in an open area with no blockages from trees or buildings nearby. Putting them on top of a roof might seem like a good idea, but the wind flow over the roof can divert the air and speed it up, so that is generally not a good place to put them, although they are certainly very decorative. Some wind sensors have separate instruments for measuring the speed and direction of the wind while others use a combined sensor that can do both at once.

Wind vane on the top of King’s Cross Station in London, England.

If you love the weather and want to know more about what is happening in your yard or garden, adding a weather station can provide you with entertainment as well as information that can be helpful to track the climate conditions in your garden such as when frost occurs and how much rain you got so you can water appropriately. It also provides a great place to compare conditions with the other gardeners in your area—you might be surprised at how measurements change from one neighborhood to the next!

Facebook

Surfing the “green wave”

Facebook

Is it spring yet where you are? How can you tell? Here in the Southeast, we are well along the path to spring, even though the calendar says we are still in winter. I can tell by the daffodils, spring peepers, and migrating birds I see overhead. I know those of you farther north may not be seeing any signs of spring yet, with winter storms still moving through your states and lots of snow on the ground as well as frigid temperatures, but trust me, it is coming!

© Jorge Royan / http://www.royan.com.ar / CC BY-SA 3.0

What is phenology?

I first heard the description of the onset of spring as the “green wave” in “The American Seasons”, a book by naturalist Edwin Way Teale. It refers to the northward movement of the appearance of the first green leaf on bushes and trees as warmer temperatures move north and the days get longer. I find it to be a very imaginative and effective way of visualizing how spring moves from south to north (in the Northern Hemisphere) over the course of the season. Phenology is the study of when specific biological and natural events occur, such as seeing the first green leaf of the year, watching your forsythia bloom, seeing your local lake freeze over, seeing sandhill cranes fly north on their annual migration, or watching your favorite tree reach peak color in fall. Many of you probably keep track of these occurrences in your own gardens and use them to compare the climate from one year to the next. But did you know that there is a whole group of dedicated observers who have done this over long time periods and recorded their data for others to see and use?

Dietmar Rabich / Wikimedia Commons / “Dülmen, Vorpark, Narzissen — 2021 — 6901” / CC BY-SA 4.0

The National Phenological Network (NPN) is a group of dedicated citizen scientists and others who keep track of the yearly occurrence of when different indicators occur and report them to the NPN. Maybe some of you are part of this network!  They have an excellent database on their website with information for many different species of plants and birds as well as other interesting phenomena. You can explore it in a number of different ways, including through time series and maps. It helps to know the Latin names for the species you are interested in because different species respond differently to the weather! I even used it a couple of weeks ago to help a film director determine how long he had to shoot a Christmas movie before the trees leafed out in Georgia (response: do it soon!).

Where is the green wave now?

One section of the NPN site shows the 2022 movement of the green wave north with time and how it compares to the long-term average conditions. This week’s map is shown below, with areas later than average highlighted in blue and areas that are earlier than average in red. You can see that while southern Florida was ahead of normal, the green wave slowed up quite a bit later in January and early February as colder temperatures covered a lot of the region. That has switched more recently, with warm temperatures across the southern Plains showing the green wave reaching there about four days earlier than usual. Spring is also early coming to large parts of the West Coast, which is currently experiencing much warmer than normal conditions in most areas. If your area is not colored yet, you are still in the depths of winter, but keep watching and spring will (I hope!) be coming soon. I don’t know of a similar product in other parts of the world, but if any of you know, please share the information in the comments.

What do phenological records tell us about climate change?

While our local records in the United States are only a couple of hundred years old at most, other parts of the world have much longer records. Last year, Japanese scientists released a graph showing the change in the peak bloom date of cherry trees in Kyoto, Japan, for the year 800 to the present. While there are a lot of ups and downs over time, the trend towards an earlier peak bloom in more recent years is unmistakable. Since 1912, the average peak bloom date for the cherry trees in Washington, DC, has also shifted forward from April 5 to March 31. Other records showing the warming of the world include migration patterns of birds, pollen counts from trees, and ice-off dates on lakes in colder areas. Glacial ice and sediment cores from lakes and the ocean can provide timelines of how local biological systems have changed over time periods going back thousands of years. Many scientists are worried about the long-term consequences of these changes since not all species are migrating at the same rate and so some animals, birds, and insects may outrun their main sources of food if they move north faster than the plants that feed them.

Phenological records are important for monitoring long-term climate change because the records go back in time much farther than instrumental weather records do. Even though blooms and leaves on plants respond to temperature and sunlight in a non-linear way because they integrate all of the influences into one observed piece of data, they can still provide very useful information about how the environment is changing over time. A really interesting related use of this information was described recently in a story showing that the meteor that ended the Cretaceous period 66 million years ago probably occurred in spring due to the remains of fish that died in the devastating massive waves in the Gulf of Mexico that occurred after the meteor hit. Scientists assumed that the fish died immediately following the impact, and used their bones to determine that the fish were early in their annual growing cycle. Similar work has used buried vegetation to trace past tsunamis in coastal areas that may have been linked to other asteroid impacts or earthquakes that occurred before history was written down.

Wherever you are, I hope you enjoy watching the change in the seasons and in the world around you as much as I do. In spring, every day is a new adventure in seeing what is changing and hoping for the summer to come. I encourage you to keep a diary or other record of what changes are occurring in your garden so that you can see for yourself how the climate is changing from year to year.

Mt Hiei in Spring from Umahashi over Takano River. Source: Hahifuheho, Commons Wikimedia
Facebook

Volcanoes and climate: How will the eruption in Tonga affect our gardens?

Facebook

If you have watched the news at all in the last two weeks, you know that there was a huge underwater volcanic eruption near Tonga in the South Pacific Ocean on January 15, 2022, that spewed ash and gases into the atmosphere. It blew with such force that the sound of the eruption was heard in Alaska thousands of miles away and the atmospheric pressure wave it set off has traveled around the earth as many as ten times according to satellite and ground-based sensors. With such a large signal, you might wonder what impact the eruption could have on our weather and climate for the next year. In this post, we will explore how volcanoes in general can affect the climate around the world and whether the Tonga eruption is likely to change our gardens’ climate this year.

What do volcanic eruptions emit into the atmosphere?

When volcanoes erupt they put out both ash and gases. The ash is made of tiny particles of rocky material from solidified lava and sometimes pieces of the volcano destroyed by the eruption. These particles are carried downwind in a direction determined by the winds at the heights to which the ash can rise. In a long eruption, the plume of ash can blow in a different direction each day, covering the ground when it falls back to earth. Usually ash does not rise very high in the atmosphere because it is quite heavy and so most of it falls out in just a few days.

Volcanoes also emit gases as they erupt. About 99 percent of all emissions are water vapor, carbon dioxide, and sulfur dioxide, with some trace amounts of hydrogen sulfide, carbon monoxide, and other minor gases. The gases are lighter than ash and so they can get lofted much higher up into the atmosphere than ash can. Because water vapor and carbon dioxide are greenhouse gases volcanic eruptions are often blamed for the recent rise in carbon dioxide in the atmosphere instead of human causes. A careful analysis of the relative amounts of carbon dioxide from the two sources easily shows that volcanic activity only contributes in a small way to greenhouse warming compared to fossil fuel burning and land-use changes. But the gases emitted do have a short-term effect on climate that can last several years in the largest tropical eruptions.

Sulfur dioxide (SO2) to sulfuric acid (H2SO4) has the most significant impact on climate. US Geological Survey.

What causes volcanic cooling?

Volcanic cooling of the climate is due mainly to the effects of sulfur dioxide and water vapor. As the gases rise, the water vapor condenses and joins with the sulfur dioxide to form tiny droplets of sulfuric acid that can rise to 50,000 feet or more, higher than most commercial jets fly. Those droplets are as shiny as the glass beads they use in stop-sign paint to make the signs reflective, and the droplets have the same effect on incoming sunlight. When they reflect sunlight back to space before it can reach the earth’s surface it reduces the energy we receive at the ground, and the earth gets cooler until those droplets fall out of the atmosphere. Because of their height and small size, that can take several years.

How does the cooling affect global climate?

We know that when you have a large volcanic eruption emitting a lot of sulfur dioxide, especially if it happens in the tropics where the sunlight is most direct, you can see cooling around the globe for the next 2-7 years depending on how much gas the eruption puts out. In the worst case, an eruption like Mount Tambora in 1815 in present-day Indonesia (along with some other eruptions around the same time) resulted in the “Year Without a Summer” in 1816. In the United States, frost was observed every month of the year in New England and eastern Canada, resulting in the loss of many crops. Even the crops that survived had low yields and poor quality that resulted in dramatic increases in food prices. Europe also saw very cold temperatures that resulted in food shortages there.

Other more recent eruptions have also had some impact on global climate, although none was as severe as the Tambora eruption. The most recent large eruption that affected global climate occurred in 1991 with the eruption of Philippine volcano Mount Pinatubo. As the volcanic emissions spread around the globe, the earth’s annual temperature dropped by almost 1 degree F in the years 1991–1993. Sunsets were also spectacular with the scattering of sunlight from the aerosols high in the atmosphere. Some scientists think painters like J. M. W. Turner were inspired by the spectacular sunsets that occurred after volcanic eruptions in the 1800’s.

Joseph Mallord William Turner (1775-1851) – Sunset – N01876 – National Gallery.jpg

Will the Tonga eruption affect the climate in our gardens in the next few years?

Since this is a blog for gardeners, you might want to know if the recent eruption will affect the climate in the same way that other eruptions like Tambora and Pinatubo did. If it is going to be much colder than average, then that could affect what you plant in your garden, especially if the plants you want to use are sensitive to frost. Or it could tell you that you might want to hold off on planting those tomato seedlings a little later than usual in spring. In this case, the amount of sulfur put out by the Tonga volcano was only about 60 kilotons compared to 20,000 for Pinatubo, so any cooling effects from the most recent eruption are so small that we will not be able to observe them. Gardeners can breathe a sign of relief this time! But when the next big eruption occurs, the climate may temporarily cool for a few years before it starts to warm again under the impacts of the “human volcano” emitting many more gases and pollutants than natural volcanoes into the atmosphere.

Facebook