In the last month, I have received many questions about media stories describing the potential for a “Super El Niño” as well as questions about the drought that has plagued many parts of the United States this spring. They have both been getting a lot of attention in social media as well as the mainstream press and you have likely seen stories about them. In this post I will describe both phenomena and how they may affect gardeners in different parts of the country.… Continue reading this article “Super El Niños and the recent drought across the US”
Category: climate
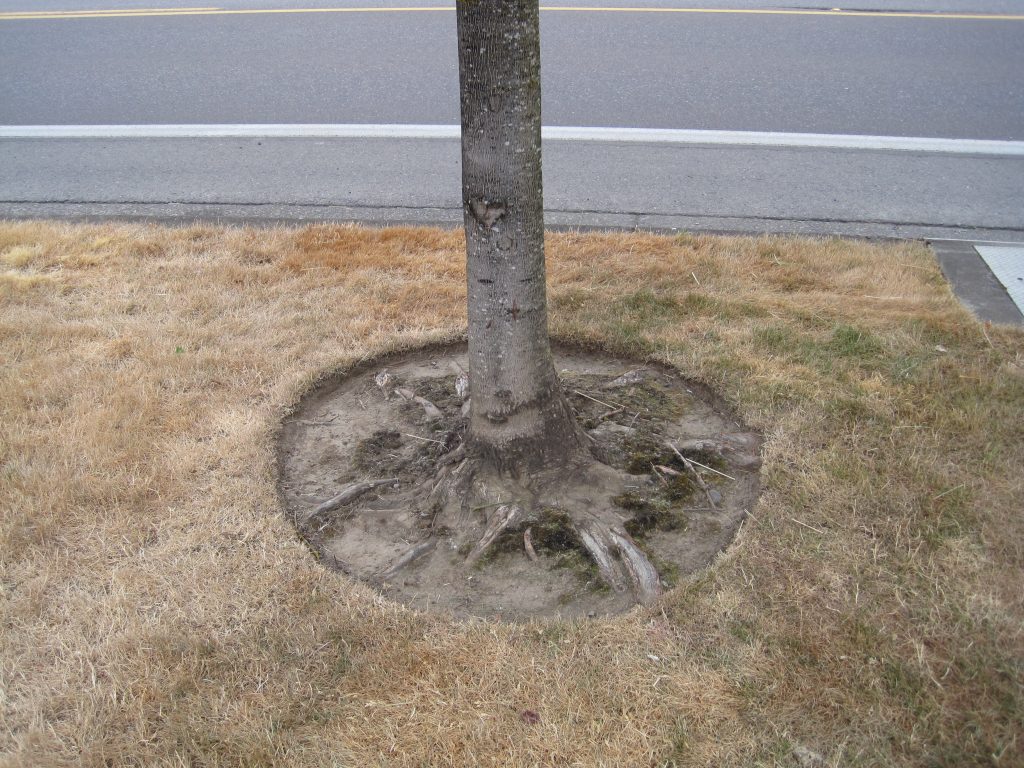
Plant lists that shouldn’t exist
Nothing drives me crazier than simplistic solutions to complex problems. Given our changing climate, there has been an explosion of “drought tolerant” and “firewise” plant lists in the gardening world. Most of these lists are devoid of science and all of them are removed from reality. The fact is that taxonomy plays a minimal role in determining whether a plant will tolerate environmental extremes.
Why seasonal climate forecasts aren’t always accurate
Do you use predictions of seasonal climate to plan your garden work? Or are you frustrated because they don’t seem to be very useful? I’ve been getting a lot of complaints this year about how bad the climate forecast for winter was because what we have seen so far has not matched the predictions in many parts of the country. Let me take a few minutes to explain how they are made and what you can learn from them.… Continue reading this article “Why seasonal climate forecasts aren’t always accurate”
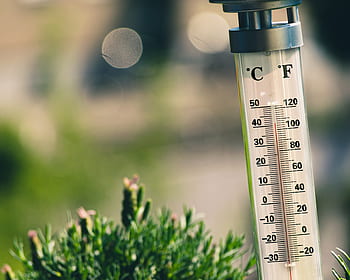
Some like it hot… but most do not: How high temperatures delay pollination and ripening
Ah, summer – vacations (pre-COVID), swimming pools (pre-COVID), ice cream, vegetable gardens, and, in many places, really high temperatures. These things all go hand-in-hand (or at least they did before the pandemic). Many gardeners feel that the heat of mid-summer goes hand in hand with garden production; those high temps driving production on those fruiting plants like tomatoes and peppers. But…..could they be wrong?
We’ve had lots of extra hot days this summer in Nebraska, so it stands to reason that we should have really great production on those garden favorites like tomatoes, right?… Continue reading this article “Some like it hot… but most do not: How high temperatures delay pollination and ripening”
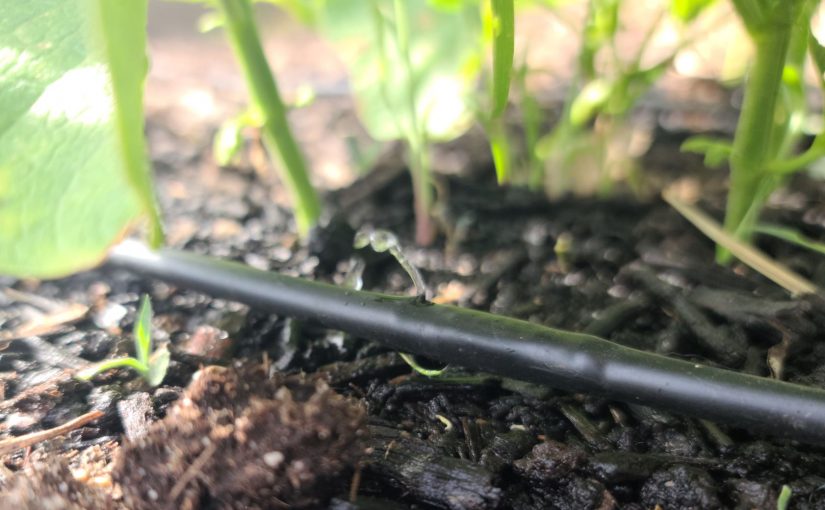
Water Wise Gardening: Conserving and Irrigating Responsibly
While we can’t ever control or even predict the weather, in most places it is important to have a plan on how to deliver water to our home gardens during the hot, dry months of the summer. Aside from reducing water need through some good management practices, delivering water in an efficient and sustainable way is important when planning and planting our home gardens.
When there is scarcity, it is necessary to conserve. Several years I got to see scarcity in person on a sustainable agriculture tour of New Mexico. … Continue reading this article “Water Wise Gardening: Conserving and Irrigating Responsibly”
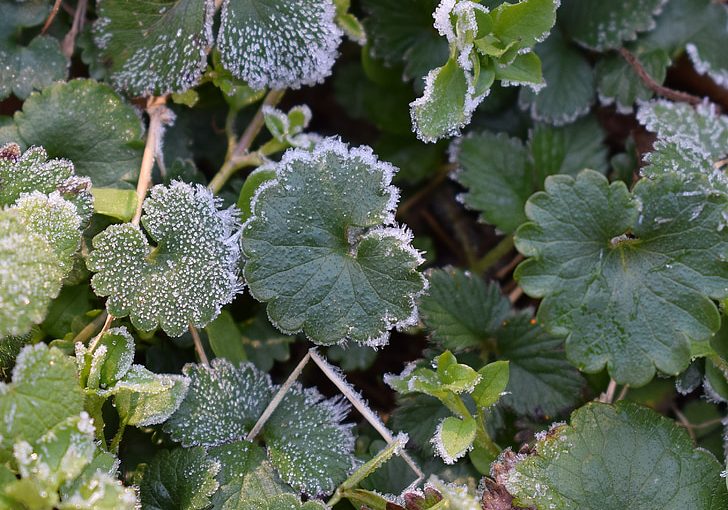
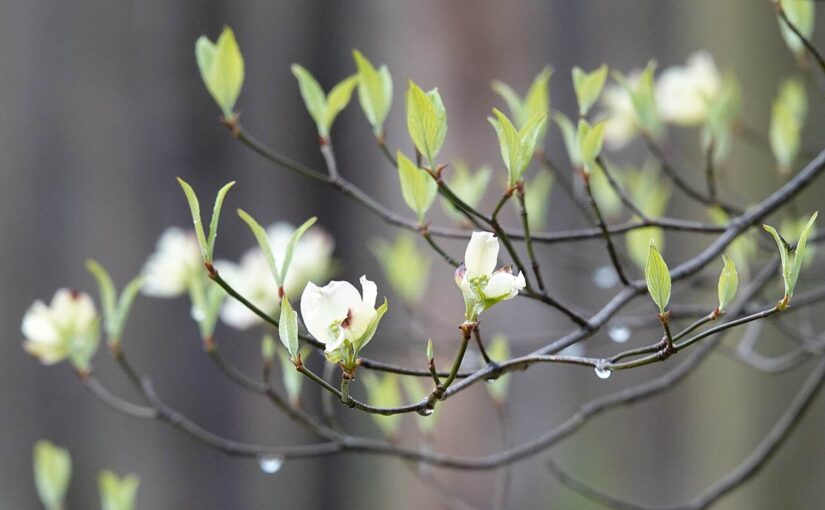
Planting Prognostication: Understanding last frost and planting dates
Except for areas of the US that are more tropical like southern Florida or Hawai’i, most gardener’s planting schedules are set around winter weather and the possibility of frost or freeze. And even for gardeners in those more tropical areas, planting sometimes needs to be planned to schedule around the extreme heat of summer. Understanding these planting times can really lead to success or failure, especially for vegetable gardens, tender annuals, tropicals, and non-dormant perennials. There are a few tools that help us understand weather patterns and predict critical temperatures for planting, namely the USDA Hardiness Zone map and the Average Last Frost/Freeze dates. … Continue reading this article “Planting Prognostication: Understanding last frost and planting dates”