A root’s life

Roots are the unsung heroes of plants! But unfortunately your every day hard working root gets little respect from gardeners. “We are so taken for granted” whined Radix– “Its just so hard, we are all down here in the dark, nobody see’s us, we get no admiration, yet we work so hard!”. Radix is your every day “working root” mostly ignored by gardeners. Even though the seasons change, and leaves come and go, Radix is growing most all the time! Gardeners love the color of flowers, the texture and shape of foliage, the architecture of tree tree branches and admire all the things plants do above ground. They beautify the world, provide us food, and provide oxygen for us to breathe. We heap our admiration on above ground functions of plants, but without Radix, and all the other roots, the above ground parts would perish.

Healthy roots growing under wood chip mulches.

Growing plants is about growing the whole organism. We may pick the fruit, admire the flowers, or rest under the shade, but none of it would be possible without proper care of root systems. Roots have varied functions—they provide anchorage so the plant can stand upright; they absorb minerals and water; and they store energy in form of starch. Plant shoots grow in the realm of light and much of their adaptations revolve around catching sunlight. Their atmosphere is mostly nitrogen and oxygen. Roots grow in the realm of soil and darkness, their atmosphere is oxygen restricted and dominated by carbon dioxide and even toxic gases like sulfur dioxide, and methane if soil conditions become saturated. Just like all parts of plants, oxygen is required by roots to respire or utilize chemical energy for their growth. Poor Radix can choke if the oxygen supply is limited.

Shoots live in a herbivorous world. Plants get eaten by animals. Because they have buds of all kinds they can grow back, leaves may contain alkaloids and other molecules that reduce herbivory, and plants can arm themselves with spines, thorns and prickles, but roots live in a microbial world. While microbes can grow on most plant surfaces, the root system is bathed in microbes (the soil food web). Not only do roots have to defend themselves underground but they have specific alliances that let them do that! As you know from some of my other blogs, root pathogens can kill all ages of plants from seedling to mature oak trees. The happens when pathogens (which are opportunists) are not well regulated by soil microbes, or when plant root systems are stressed in some way. Large populations of soil bacteria, fungi, nematodes and arthropods limit the development of opportunistic pathogens. These organisms are supported by soil carbon or organic matter which is essential to their abundant reproduction in soil. This carbon is best supplied to root by mulching with freshly chopped Arborist chips.

To examine root health, expose the cortex with a knife. It should be white, an unhealthy root will be discolored. Many roots are black on the outside and this is normal as they have melanin in their epidermis as a protectant against microbes.

Roots store carbohydrates made in leaves as starch. This stored energy can be used for their growth or redistributed through the plant later. In order for stored starch to be used, it must be converted back to glucose (by enzymes) and then broken down through chemical respiration. These processes take oxygen which is limited in soil as a function of depth. The deeper you go the less oxygen. This is why trees and most plants have roots in the upper foot or so of soil. This upper foot of soil is sensitive and fragile. It can be compacted by foot traffic or equipment and lose oxygen content. Weed barriers, fabrics, and sheet mulching deprive soil of gas exchange, and the amount of carbon dioxide increases at the expense of oxygen under these barriers. Too much water can fill soil pore spaces causing saturation that usually contain oxygen and decrease the amount of available oxygen since it does not dissolve well in water. All of this also applies to the soil microbial communities which also require oxygen to grow and thrive.

A healthy soil contains plant roots (top) and an abundance of micro organisms. These soils will be porous, contain higher levels of organic matter and mycorrhizal fungi (white portion at the bottom of image)

So how do we respect Radix and all the other hard working roots? Promote soil health by avoiding tillage and cultivation. Use Mulches made from fresh tree trimming chips, avoid compacting soils with machinery, and do not shock soils with excessive application of manure, fertilizer, or water which can perturb the microbiology of a soil. I also suggest you learn to admire roots for all that they do for plants in your garden. Check in with Radix every now and then by digging down and looking at root systems. See if they are growing. Try to learn the seasonality of peak root growth so that you avoid practices that may harm roots during their critical growth periods. Be alert to the symptoms of root rot on garden plants especially at the tops of plants such as leaf drop, shoot dieback and wilting.

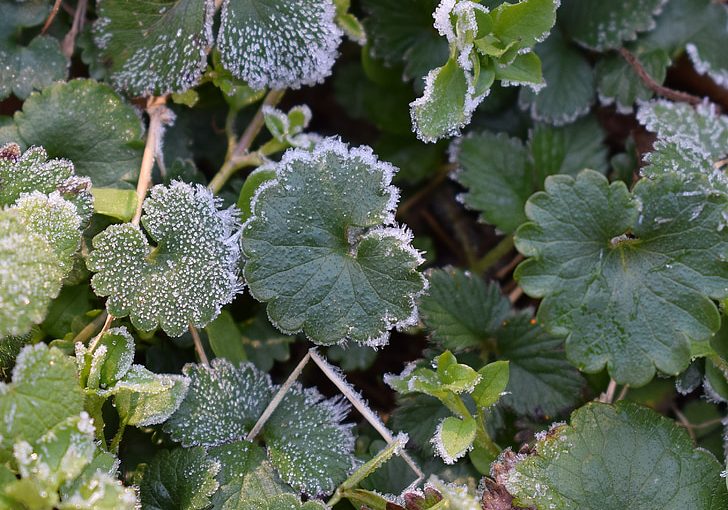
Planting Prognostication: Understanding last frost and planting dates

Except for areas of the US that are more tropical like southern Florida or Hawai’i, most gardener’s planting schedules are set around winter weather and the possibility of frost or freeze.  And even for gardeners in those more tropical areas, planting sometimes needs to be planned to schedule around the extreme heat of summer.  Understanding these planting times can really lead to success or failure, especially for vegetable gardens, tender annuals, tropicals, and non-dormant perennials.  There are a few tools that help us understand weather patterns and predict critical temperatures for planting, namely the USDA Hardiness Zone map and the Average Last Frost/Freeze dates.  The USDA Hardiness Map shares data on what the average coldest temperature is, which is key for selecting perennial plants that you want to survive the winter.  However, to know when to plant we look at the average freeze and frost dates.  There seems to be a little bit of mystery, and even confusion, around the dates and how to interpret them, so let’s take a little time to understand them a little better.  And since my background is in vegetable production, I’ll share a bit more detail there in terms of plants – but you can translate the information to ornamentals, especially those that are frost tender pretty easily. 

Understanding Average Last Frost Date

What is the average last frost date and how is it figured?  The average last frost date is exactly what it says it is – the average date at which the probability of frost has diminished.  Just how diminished really depends on the source, so we’ll follow up with that in a bit.  The data is computed by NOAA (National Oceanographic and Atmospheric Administration) and the National Weather Service to determine the probability of temperatures relating to frost and freezes based on weather data for an area over the last 30 years.  They compute the likelihood of a light frost (36 F), frost/heavy frost (32 F), or freeze (28 F) at three different probability levels – 90% (the temperature is very likely to happen), 50% (the possibility is 50/50), or 10% (the temperature is unlikely).  This tool from NOAA provides a chart with probabilities for locations throughout each state.  

This data is typically collected and analyzed every ten years or so.  I’m not exactly sure when the last data was analyzed, but I did find some maps on the NWS referencing the period 1980/81- 2009/20 (below).  Therefore it is likely that new data will be released either this year or next year.

Temperature hardiness of common vegetables

Awareness of tolerance is especially important for vegetable crops, as the growing season and expected productivity of the plants.  The following chart is a general guideline, and your mileage may vary based on cultivar difference, microclimates, and other factors.  Also note that these temperatures are for both planting in spring and fall kill temperatures.  Some of the more tender plants, like tomatoes, may withstand colder temperatures when they’re mature so they may be less susceptible to frost at the end of the season vs. the beginning of the season. 

Season extension techniques, such as row covers can be used to protect tender plants in the spring and extend harvests in the fall.  Row covers can be selected by the degrees of protection they deliver.  For example, a row cover may offer 4 degrees of protection.  This allows the protected plant to withstand air temperatures 4 degrees colder that what it would unaided. For fall crops, note that plants may stop growing well before the kill temperature but will hang out in “stasis” until they are killed. The above NOAA chart provides probabilities for both spring and fall – allowing you to not only plan for spring planting but also for fall crops.  For scheduling fall crop planting dates, find your first frost date, count backwards the days to maturity (from the seed packet or tag), and add a few weeks for a harvest window and for the slowing growth as temperatures drop.

The Problem with Probability

These probabilities are based on past weather data, so keep in mind that these dates are used as a prediction not as a guarantee.  It is especially important to remember this as weather uncertainty increases with climate change.  Last frost could occur well before or even well after these predictive dates.  This also begs the question – which probability should you use?  Looking around at different sources, you might find sources that use either the 50% or 10% probability statistic, and there seems to be a bit of disagreement as to which one should be used.  Based on the data for my region, I’ve seen sources share both dates.  It really comes down to how much of a gamble you want to take or how much you want to push up harvest or maturity.  If you plant on the earlier 50% probability date you may end up having to cover the plants a few times to protect them from frost.  But each day that passes means that the chance of frost or freeze decreases.

Whenever I give a talk here at home in Omaha, I often ask my audience to guess what the average last frost date is for planting.  Invariably, the answer I get is Mother’s Day…which I guess works as a guidepost in general.  However, looking at the data (below), we can see that the 10% probability date for a 32 degree (killing) frost is May 4.  The light frost date is May 11 – plants may be damaged but not killed unless they’re very tender.  And the 50% probability date for a killing frost is actually April 21, which is the point where the probability of frost is 50% each day (and the probability shrinks each day.

Sometimes produce growers may opt to go early to get vegetables to market – which extends the sales season and allows them to charge a premium price if no other growers are selling.  Season extension techniques like high tunnels have also pushed back farm production dates.  As climate change makes weather more unpredictable, we may all be finding ways to alter the growing season as a norm rather than an exception.  Until then, we’ll rely on the data we have to make the best predictions.   

Sources:

https://www.canr.msu.edu/news/freeze_damage_in_fall_vegetables_identifying_and_preventing

http://www.gardening.cornell.edu/homegardening/scene0391.html

https://www.weather.gov/iwx/fallfrostinfo

https://www.ncdc.noaa.gov/cgi-bin/climatenormals/climatenormals.pl?directive=prod_select2&prodtype=CLIM2001&subrnum%2520to%2520Freeze/Frost%2520Data%2520from%2520the%2520U.S.%2520Climate%2520Normals