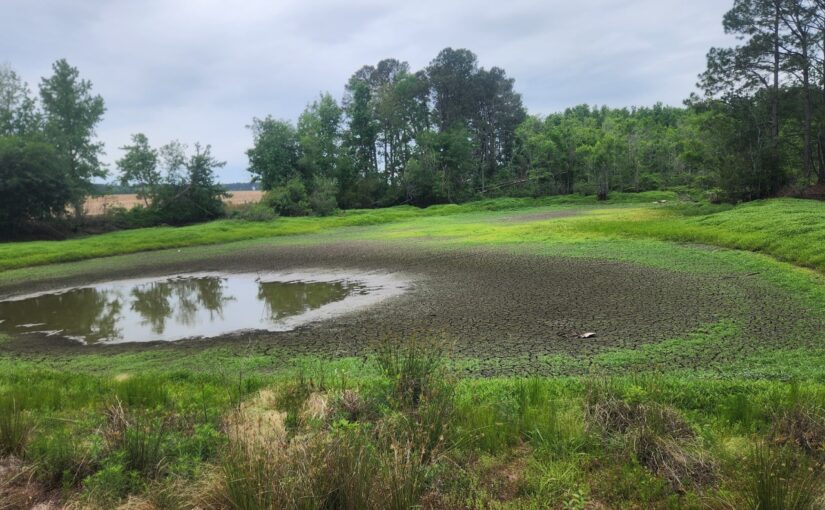
In recent months, large parts of the United States have been covered by drought, including my home region of the Southeast. This year’s drought there was caused by a combination of three things: the lack of any significant tropical activity in the US in 2025 (except TS Chantelle in the Carolinas), the La Niña that occurred over the winter, leading to warmer and drier conditions than usual (in spite of several cold outbreaks that caused significant damage to farms as far south as central Florida in January and February), and the early onset of summer high pressure in March and April that shut down any potential for the development of precipitation.… Continue reading this article “When is a drought over?”
Author: Pam Knox
Pam Knox is the Director of the University of Georgia Weather Network and an agricultural climatologist who studies how weather and climate affect crops, livestock, forests, and water resources. She posts stories about current weather and climate issues as well as impacts of changing climate on her blog, "Climate and Agriculture in the Southeast."
Super El Niños and the recent drought across the US
In the last month, I have received many questions about media stories describing the potential for a “Super El Niño” as well as questions about the drought that has plagued many parts of the United States this spring. They have both been getting a lot of attention in social media as well as the mainstream press and you have likely seen stories about them. In this post I will describe both phenomena and how they may affect gardeners in different parts of the country.… Continue reading this article “Super El Niños and the recent drought across the US”
How the weather affects gardeners’ health
In this blog, I usually talk about how the weather affects gardens and plants, but today I am going to change the focus and talk about how the weather affects gardeners. By now, many of you in the Southern US and other parts of the Northern Hemisphere are starting to see spring leaves and flowers appear and are busy working outdoors in your gardens planting new crops and flowers or getting the soil ready to take the seedlings.… Continue reading this article “How the weather affects gardeners’ health”
“Frightful weather”—Snow, ice, and the polar vortex
Have you noticed that this winter has been full of ups and downs in temperature, with warmth and drought in some areas and impactful winter storms in others? The western United States has been mostly warmer and drier than normal with little precipitation except in the highest peaks, and even then, it has been scarce. The eastern United States has been hit by several significant winter precipitation events and a crippling freeze that reached down into central Florida.… Continue reading this article ““Frightful weather”—Snow, ice, and the polar vortex”
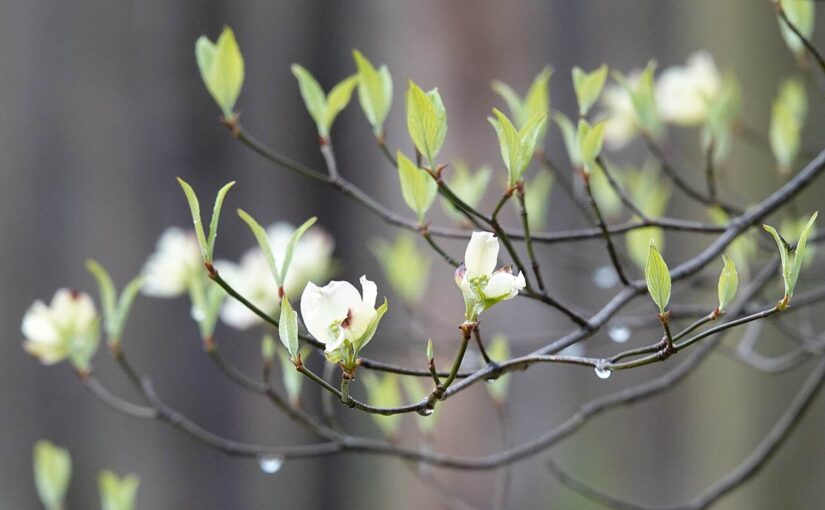
The march of the seasons
Everyone has their favorite season. Mine is spring, because of the pop of early flowers, the hundreds of shades of green that appear as bushes and trees leaf out, and the warmer temperatures that come with the march towards summer. Winter is my least favorite because of the lack of color after the deciduous trees drop their leaves, leaving stark black branches against white clouds or snow. I admit I don’t like the cold either! Most of us talk about the seasons a lot, but what are they really?… Continue reading this article “The march of the seasons”
Goodbye to another weather year–2025 in review
How did your garden fare this year? No matter how it grew, at least some of the impact was due to this year’s weather, although careful soil preparation and a good watering plan can fend off some of the worst effects. As usual, my last blog post of the year will be a brief review of this year’s climate and a look ahead to next year. Gardeners must prepare as well as dream! My review will focus heavily on the United States, but I will try to put in a little for our non-US readers too.… Continue reading this article “Goodbye to another weather year–2025 in review”
Weather forecasting for gardeners and how social media misuses those predictions
If you spend much time on social media, you have probably seen screaming headlines on Facebook, Twitter, or elsewhere about impending extreme weather. In the last few weeks I have seen wild stories about a late-season tropical storm forming in the Caribbean and an Arctic outbreak and snowstorm heading through the eastern US all the way to the Gulf. Neither of these had any real chance of occurrence but the people who post them are looking for clicks and attention.… Continue reading this article “Weather forecasting for gardeners and how social media misuses those predictions”
Let the sun shine!
This time of year, I frequently notice the change of the sun’s daily position over time, since my family room faces east. This is especially true as most of my trees on that side of the house are deciduous—as the leaves fall, I get a better look at where sunrise is actually occurring and how it is changing day by day. Sun angle and the amount of sunlight that reaches different parts of your garden can have a big impact on what kinds of plants you can grow and how your garden appears.… Continue reading this article “Let the sun shine!”
How different types of precipitation affect your garden
In my household, the weather is a common subject of conversation. That is only partly because I am married to a meteorologist. In fact, I have noticed that I can talk to almost anyone about the weather, and I suspect you can too. Weather is most captivating when something interesting is occurring, like liquid falling from the sky. When I give talks to master gardener groups, they are almost always consumed with how the weather is affecting their gardens.… Continue reading this article “How different types of precipitation affect your garden”
Getting Ready for Fall: What do the long-range outlooks tell us?
The cooler weather that many parts of the eastern United States are experiencing this week is causing many gardeners to think about what this fall will be like. In fact, many farmers in Georgia are already planting fall crops, and I am sure that many gardeners are also busy with their own fall planting if they live in the Northern Hemisphere mid-latitudes. In this blog post we will discuss seasonal forecasts and how you can use them to plan and plant your garden.… Continue reading this article “Getting Ready for Fall: What do the long-range outlooks tell us?”