While drought is part of the natural cycle of the climate and many native plants depend on drought to propagate, it is the bane of gardeners everywhere because of the increased need for water. I have previously written about the four types of drought. Today I thought I would focus on drought monitoring and a way that you, as a citizen scientist, can help report local conditions that the official drought monitor authors can use to fine-tune their depictions of drought. This will be especially helpful this year with so much of the country in drought conditions.
What is the Drought Monitor?
The U. S. Drought Monitor (I’ll call it the DM here) is the source of the “official” drought status across the country. Of course, you don’t need an official status to be in drought but it is commonly used by media, government agencies, and scientists to categorize the strength of drought over time and space. The official DM map shows a single map for the United States updated each Thursday morning that is color-coded by five levels of dry conditions ranging from Abnormally Dry (D0) to Exceptional Drought (D4). The drought categories show experts’ assessments of conditions related to dryness and drought including observations of how much water is available in streams, lakes, and soils compared to usual for the same time of year. If there is no color shown then that region is not officially in drought. If it is in D0 (bright yellow on the map), then it is considered dry but not currently in drought. Often a D0 designation means either that drought is imminent or that there are lingering impacts from a drought that is ending. You can read more details about what kinds of impacts are seen in each level of drought and how the weekly map is produced on their “About” page. You can also find links to state-specific impacts there, since a drought in the Southeast does not look like a drought in the Southwest, for example.

Issues with the DM
One of the shortcomings of the DM is that there is just one weekly map that is supposed to be a complete depiction of drought across the United States. If you read my last post on drought, you know that drought comes in different varieties that occur over different time periods. Agricultural droughts are caused by dry spells and hot temperatures during the growing season and can come on very quickly (“flash droughts”), while the long-term precipitation averages might not reflect that lack of water and so would not be captured on the DM map. Hydrological drought is related to a long-term lack of rainfall that reduces the water levels of lakes, streams, and reservoirs over many months or even years. It might not affect gardens and farms significantly as long as enough rain falls at regular intervals to keep the plants alive.
While the DM was not created to be a legal means for defining drought, it has become one in legislation passed by Congress to provide drought relief to affected farmers. The program I deal with the most in my work is the Livestock Forage Disaster Program, which provides a payment to forage producers to offset economic losses if drought stops the growth of pastures, especially early in spring when hay supplies are depleted over the winter. The law is written in such a way that if the drought level is severe drought or worse (D2+) for eight consecutive weeks, then they can receive one month’s payment for the lost forage. If it is in extreme drought (D3) somewhere in their county for any time during the growing season, then they can get payment for three months.

As you can imagine, when a flash drought happens and the grass stops growing the forage producers need the relief to help purchase hay to keep their livestock alive. But the DM does not typically depict this quick-changing drought because it is based on longer-term indicators that do not change much over just a couple of weeks. So there is a disconnect between what the DM is showing and how it is being used for legal purposes, at least in the case of forage and pastures.
As you might guess, this results in some attempts to game the system to make it look drier than it is to get the DM authors to declare a D2 or higher drought. The authors tell stories about being harassed over the phone about where they draw the drought lines on the map, finding observers who report no rain when radar clearly showed it occurred, and other creative ways to make the drought appear worse than it is so they can get access to the payments they need.
How can you monitor and report drought?
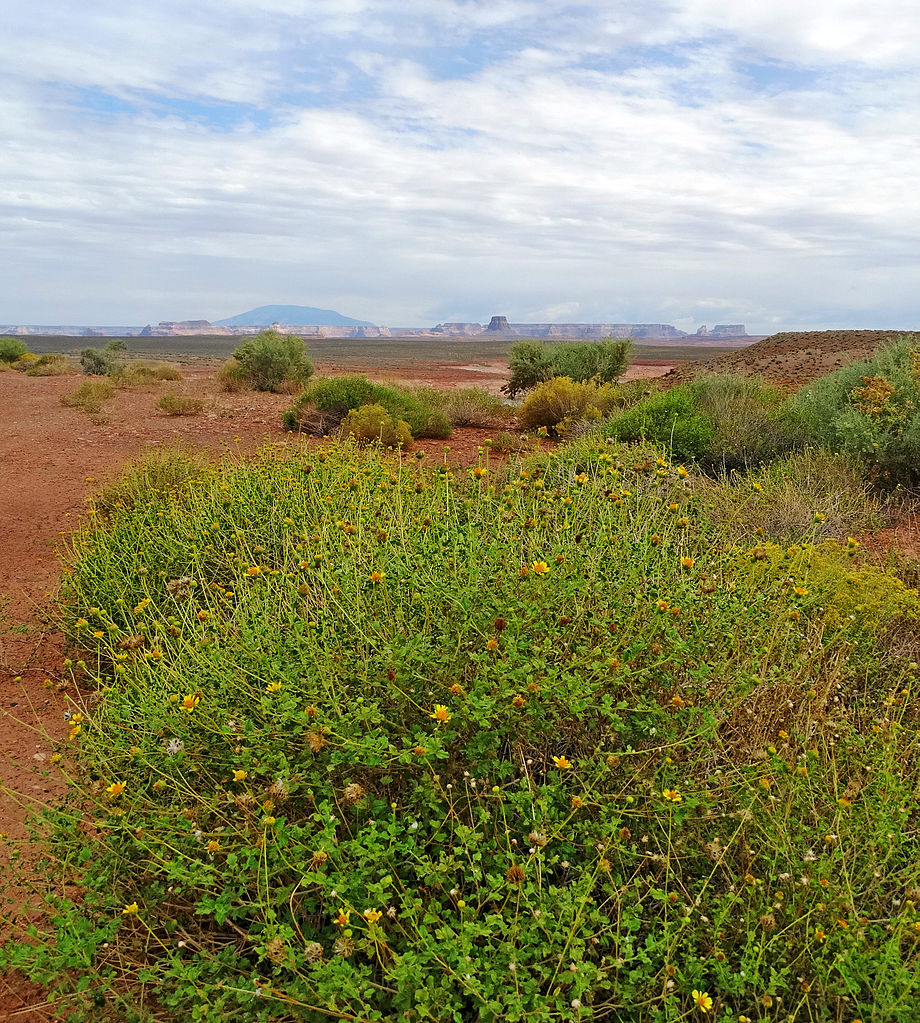
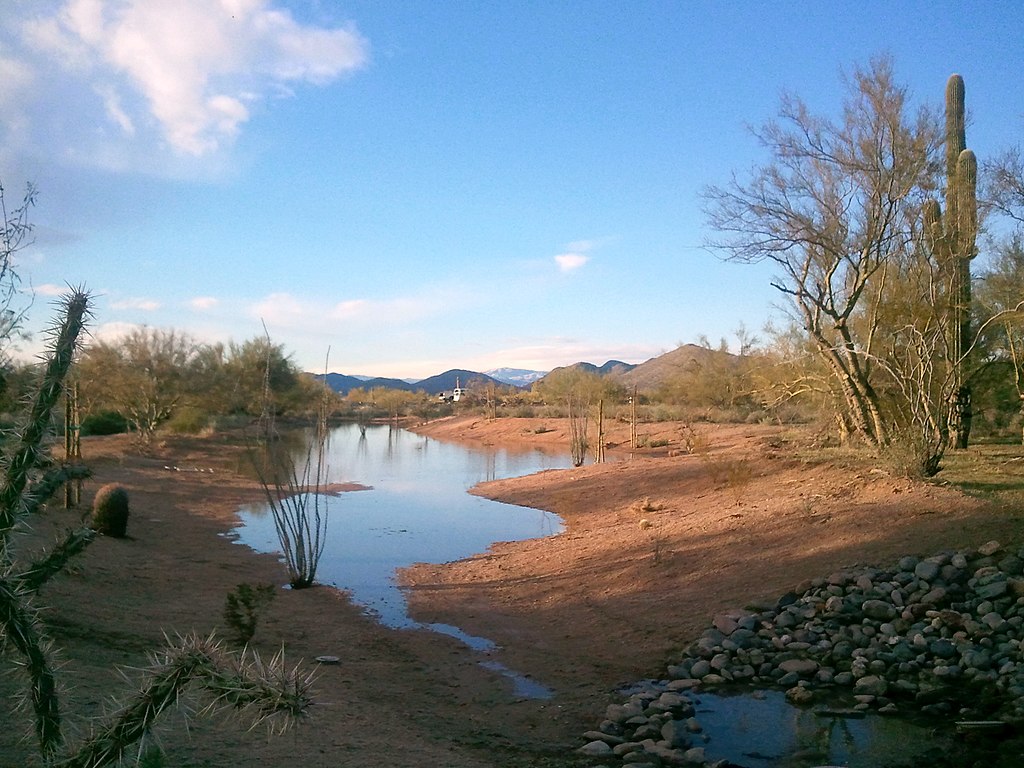
Here is where you come in: Citizens like you have an important role to play in keeping an eye on local vegetation and monitoring it for signs of drought or impacts from saturated soil. Gardeners are already especially attuned to what conditions are normal and what conditions are not. Folks who monitor local climate conditions are much like storm spotters who monitor weather systems for strong winds and tornadoes—they watch how things evolve over time and provide that information to the authors of the DM and others who need hyper-local information, although on a much longer time-scale that storm spotters. If you are a CoCoRaHS rainfall observer, you probably already know about the Condition Monitoring report that you can submit through their website. Another great place anyone can submit official Condition Monitoring Reports (called CMOR which is pronounced “see more”) is the CMOR site on Drought.gov.
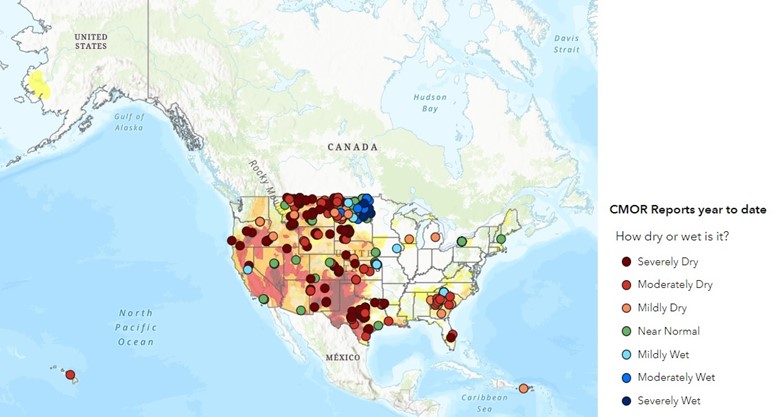
As you can see from the map above, there are many parts of the country with no CMOR reports to provide information about conditions at those spots. By providing these reports, you are helping the DM authors with unbiased, fact-based local observations that can support other drought indicators like streamflow, precipitation deficits, and groundwater losses. Thanks for providing this service to the DM authors and other scientists!