When trees can’t predict weird weather

Our normally mild corner of the country got hit early and hard with cold weather a few weeks ago. For several days straight, our home thermometer read anywhere from 22-25F. Now, Seattle routinely gets temperatures this low sometime during the winter. But this cold spell came very early – much earlier than our regionally adapted trees and shrubs were used to. The effect on our plants was significant.

20141112_080049
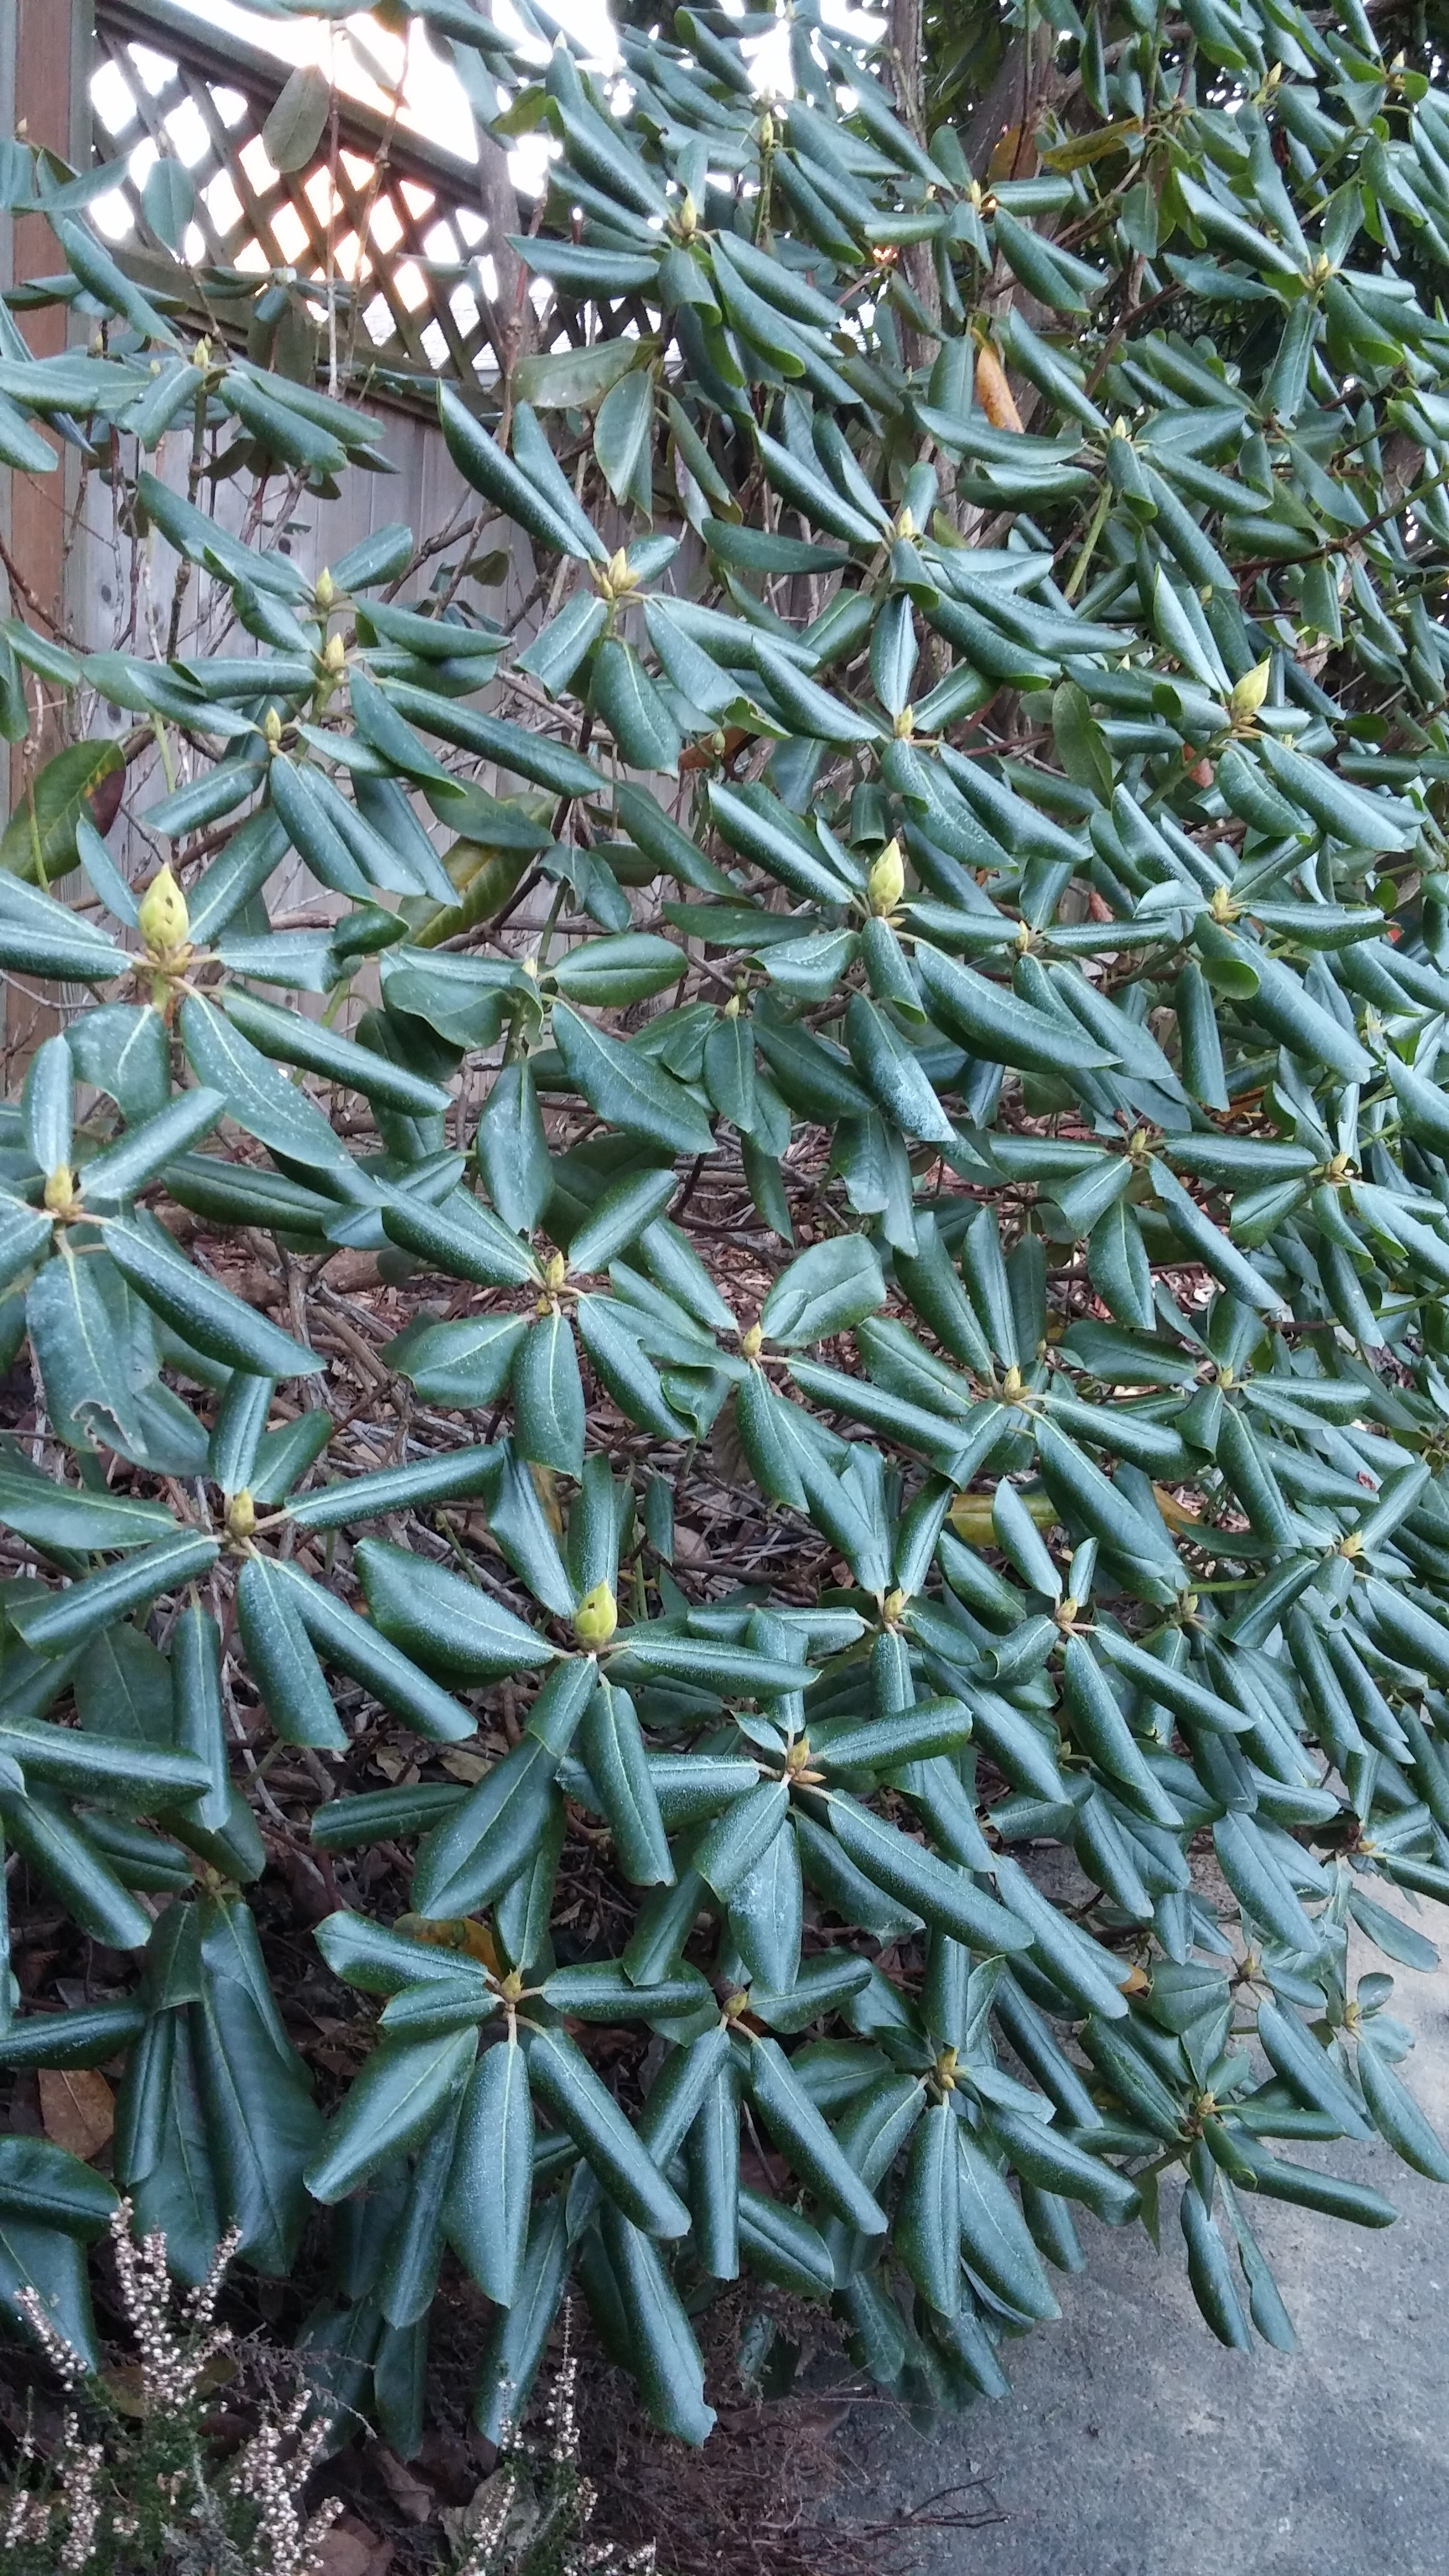
Rhodies react to cold but tolerate the freezing temperatures

Trees and shrubs start getting ready for dormancy in the summer. They key in on the progressively shorter days and make biochemical preparations that are unnoticeable. When the first frosty evenings arrive, leaf color changes begin immediately. Chlorophyll, proteins and sugars are scavenged and stored in trunks and roots – we see leaves change from green to red, orange, yellow, and eventually brown. Slowly an abscission layer is laid down at the base of the leaf petiole, and when the layer is complete the leaf dies and falls.

But this year the trees weren’t ready. It got cold really fast, and green leaves died on the trees. And they are still there. Eventually these old leaves will fall, though some of them may stay on until spring.

Cold shocked leavesBoth the hydrangea in the foreground and the styrax in the back have retained their leaves after the cold snap.

What does this mean in terms of tree health? Well, it won’t kill them, but it does set them back in terms of food storage. A lot of the nutrients that were still in the leaves when they froze are lost to the tree. So there may not be as many reserves for winter root growth, or for spring leaf flush. Overall, we could expect to see less than normal growth in established trees and shrubs.

Infographic with a BIG grain of salt

Infographics can be great: They’re bright colorful ways to make sometimes complex concepts visual and easy to understand. Sadly, “easy to understand” does not necessarily equal “accurate” and they can also be extremely misleading.

Take this beautifully made image from National Geographic. It is an older image — first posted back in 2011, but it makes the rounds on social media from time to time, and popped up in my facebook newsfeed a couple days ago.

Look at it! Oh no! We’re loosing all of our vegetable genetic diversity!

Or not. First, it is comparing apples to oranges. This image looks a commercially available varieties in 1903 and compares it to the number of varieties in one specific center for preserving genetic diversity. What happens if we compare the same metric? If you look at the number of varieties in the National Seed Storage Laboratory, that was founded in 1958… so in 1903, at the top of the graph, the number for all these vegetables would be… zero. If you look at the present day, the current umbrella organization for all the US government funded efforts to preserve genetic diversity of crop plants is GRIN, (Germplasm Resources Information Network)  and if I do a quick search through that database using the keyword “tomato” I get… 9281 results. That is a pretty overwhelming improvement over 79 in 1983.

And what about commercially available varieties? To use tomato as an example again, in 1903, they found 408 varieties offered commercially. I just added up the varieties listed by just ONE seed company, Baker Creek Seeds, currently lists 287 different varieties of tomatoes. That is just ONE company. I have no doubt that if I added up all the varieties that are offered for sale in the giant pile of seed catalogs I get every spring it would be FAR more than the 408 on offer in 1903.

So… are we losing genetic diversity in our crop plants? Probably. There are lots of traditional varieties and land races that were never available commercially that have do doubt been lost, but to be honest, I think we’ve done a pretty good job at preserving the diversity. And certainly the USDA’s system of gene banks is an incredibly well run, impressive thing that deserves high praise indeed, for not merely preserving vast amounts of important genetic diversity but also working hard to characterize it and make it available to researchers and breeders so it can actually be put to work in the development of new and improved selections to try and feed the world.

So despite how colorful and easy to understand this infographic is, you don’t need to freak out about a massive loss of genetic diversity in our vegetable crops. Save that freaking out for all the wild species that have gone extinct or are about to go extinct thanks to habitat destruction and climate change world wide…

You think YOU had a bad day…!?!

I'm itchy all over.
I’m itchy all over.

Just downloading some photos from the end of the summer, and found this. Rarely can I work up sympathy for a tomato hornworm (Manduca quinquemaculata). Though the moth is quite lovely, the caterpillars really did a number on my tomatoes (and two spindly eggplants) this year, and I recall joyously taking this photo in August.

However, I’ve had a rough Monday, and can kind of relate to being covered in Braconid wasp pupae. The larvae have chewed their way through the caterpillar, to spin their grisly cocoons of death (would have made a great post a couple of weeks ago) and dangle there in the breeze until emerging. I know it is nature’s way, but, dang.

Get a handle on your microclimates

Practically the first thing a budding gardener (at least in the US) learns is their USDA winter hardiness zone. Based on average winter low temperatures, hardiness zones have many flaws but are still a very useful tool in figuring out what plants can and cannot survive your particular winters.

Right after learning about winter hardiness zones, we generally hear about microclimates – the idea that small precise locations within our garden may be, sometimes significantly, warmer or colder (or wetter or drier) than the surrounding climatic norms. The most pronounced producer of microclimates in most people’s gardens is their house – the sunny southern and western walls in particular can be markedly warmer than the rest of your yard. If you have hills, you also get frost pockets in low lying areas and warm south-facing hill sides.

But just how much warmer ARE your microclimates?  I used to live in a drafty, poorly insulated nearly 100 year old house which had VERY warm microclimates all around it because all the heat my furnace put out was rapidly leaking out into the outside world. Great for growing plants that normally wouldn’t take my winters, but oh, the heating bills! A modern, well insulated house leaks a lot less heat out into the garden. Over time in a garden, you can learn by trial and error just how far you can push growing tender plants in warm microclimates by planting things and watching them die or survive. But there is an easier and faster way to figure out your microclimates. Collect some actual data, getting firm numbers of how warm and cold different parts of your yard are.

20141104_130607

I’m heading into the first winter in a new garden, and getting ready to deploy a handful of cheap mechanical min-max thermometers. I’m placing one out in the open, the others against the south wall of a shed and other places I think should prove to be warm microclimates. Out they go, and after particularly cold weather – or just in the spring – I can check the different minimum temperatures they’ve recorded. A few degrees differences isn’t worth worrying about, but get to 10 degree differences, and you are talking a whole winter hardiness zone warmer.

In addition to comparing different locations in my garden, I also like to compare the actual temperatures I’m recording with those from local official weather stations (to do that, just go to www.weather.gov, enter your zip code, and then click “3 day history” on the right side of the screen). The zone map is created based on readings from weather stations like these, and if your particular yard is consistently showing temps warmer or colder than the local official readings (provided, of course, your thermometers are accurate), you should adjust your winter hardiness zone accordingly.

Finally, a min-max thermometer is a great way to test various winter protection methods. Tender plants can be insulated with a thick layer of leaves or (my favorite) cut conifer branches or even styrofoam boxes. How well do these protections work in your garden? Tuck a thermometer in with the plant before you cover it and then, come spring, check the minimum temperature it recorded against what you saw in the open air. Again, a difference of 10 degrees Fahrenheit corresponds to a whole winter hardiness zone warmer, giving you real actionable information about what you might be able to over-winter with the help of different sorts of insulation.

It is worth reiterating that minimum winter temperature is only one of a myriad of factors that go into winter hardiness, moisture, duration of cold, health of plants, and even summer heat matter as well, but winter lows are important, and it can be easily and precisely measured. So why not get some numbers on it so you can have a better idea of just what tender plants you can get away with in your various microclimates? A few thermometers is a lot cheaper than putting out a bunch of rare perennials and having them freeze out on you.

Is it an Elmaple!

So let’s see here…someone planted a nice little Japanese maple outside a hotel, and everyone was happy. Then an elm started to grow next to it, and it looked pretty good. In fact, it looked better than the maple. So, what the heck? Let the elm grow and ignore the maple. And now….At what point do you decide which tree to sacrifice so that the other can live a reasonably healthy life? (Yes, there is a correct answer!)

image