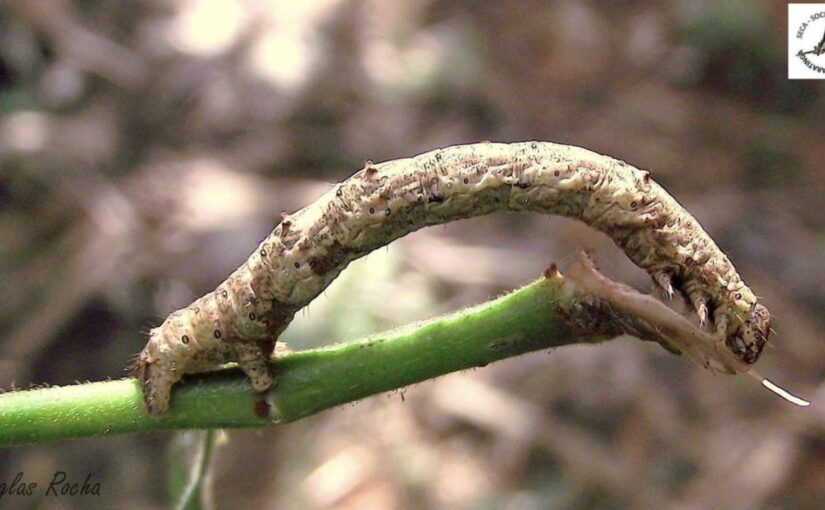
The warmest year on record ends–will 2024 be hotter?

This year is almost certain to be the warmest on record for the earth as a whole, although there are still a few days in December that could slightly affect the final numbers. As we close out 2023 I want to spend a few minutes reviewing the weather and climate of the past year, both the average conditions and some of the extremes we saw. While this is skewed towards the United States, I did include some events happening in other parts of the world for our non-US readers. I will also take a peek at what is likely to happen in 2024.

Great Sand Dunes National Park and Preserve, Commons Wikimedia.

What were the average climate conditions in 2023?

Since the year is not quite over I can’t provide a final average for temperature or precipitation for the complete 365 days, but there are some websites that allow me to look at all but the last few days. The images below are from the High Plains Regional Climate Center for January 1 through December 27. They show the temperature departure from normal and the percent of normal precipitation for the continental United States. (You can see the global temperature statistics for January through November 2023 at the National Centers for Environmental Information.) In most parts of the U.S. the temperature was warmer than the 1991-2020 normal; the exception was the western mountains, where temperatures were colder than normal. Keep in mind that the normal period being used for comparison (1991-2020) was a period that was quite a bit warmer than the long-term temperature average in the United States, so this map underestimates how warm this year was compared to most of the 20th century.

Precipitation was more variable than temperature, as it usually is. The driest areas this year were in the southwestern Gulf of Mexico states, particularly Louisiana and Texas, and in the Pacific Northwest.  It’s not surprising that these were also areas with significant droughts, including a lot of the Corn Belt which also saw very dry conditions during the growing season. By comparison, California and New England experienced multiple storms bringing significant rain to those areas, including Tropical Storm Hilary (the first tropical storm to hit California in 84 years) in mid-August. In the Southeast, Hurricane Idalia did almost $5 billion in damage in late August from heavy wind and rain, half of that in Georgia alone. But that did not stop a flash drought from developing there in fall with the almost complete cessation of rainfall for up to 60 days.

What extremes did we see in 2023?

The averages show the overall conditions that occurred this year but don’t begin to capture the extremes in temperature and precipitation that occurred. In the United States alone there have been 25 billion-dollar weather disasters so far this year, including the tropical systems mentioned before along with numerous rounds of severe weather across the country and the devastating firestorm in Maui in August. In other parts of the world, many regions experienced their warmest September-November period since records began in 1880. Significant heat waves occurred in Texas and Mexico as well as Europe, Chile, and Canada, where widespread forest fires that flared up blanketed Canada and many parts of the eastern United States with poor air quality and low visibility in the summer.

Percentage of continental US covered by drought status, ranging from abnormally dry (D0) to exceptional drought (D4) from 2019 to 2023. Source: US National Drought Monitor.

Floods and droughts occurred around the world this year. The Mississippi River dropped to record-low water levels for the second year in a row due to the drought in the Midwest. On the other extreme, notable flood events occurred around the world, include floods in Ghana, the Horn of Africa, Pakistan, Bangladesh, and Chile. Storm Daniel brought unprecedented rain to Libya, breaking dams and causing tremendous damage in September. Nine separate atmospheric river events caused tremendous flooding in California early in the year, significantly reducing drought conditions there and contributing to the reduction in drought area in the United States in the first half of 2023.

While El Niño usually means that the Atlantic tropical season is quiet, this year was unusually active with 20 tropical storms and hurricanes. This is in spite of the presence of a jet stream aloft due to El Niño that usually keeps storms from developing. Most of those storms stayed out to sea, so impacts on the United States were limited (except for Idalia and Hilary out west). In other countries, Hurricane Otis hit western Mexico near Acapulco in October, bringing catastrophic damage to an area that almost never gets hits by tropical storms. Cyclone Lola devastated the northern part of Vanuatu in late October as well.

Monthly global temperature compared with the average for the 20th century. Source: New York Times (link below).

The global temperature will set a new record for warmth in 2023

The New York Times provided a sobering look at monthly temperatures for each month going back to 1850 (above). It shows that 2023 had several months that were the warmest on record for those months, due to the expansive area of warm ocean water associated with El Niño in the Eastern Pacific Ocean along with record-setting sea surface temperatures in the Atlantic that contributed to a very active tropical season in spite of being an El Niño year. The impacts of this warmth are being seen in dropping sea ice coverage, more and stronger heat waves, and increases in wildfires in forested areas. Some people argue that the warming trend appears to be accelerating in recent years, a concern that urges us to consider how we can reduce greenhouse gas emissions and slow down the increasing temperature trend.

What do we know about 2024 so far?

The current El Niño is expected to continue through the next few months before it weakens and turns back to neutral conditions around the April-June period. A La Niña could occur later in 2024, which means that next year’s winter could be warm and dry in southern parts of the Northern Hemisphere and colder and wetter along the northern border of the US and up into Canada. Pending on how long the El Niño lasts, the warm ocean temperatures could contribute to another record-setting warm year in 2024 although it’s too early to be sure. It also depends on shorter-term weather events like more frequent occurrence of cold weather due to a shift in the weather pattern in January to more variable conditions later this winter, as many forecasting models think is likely. Meanwhile, neutral conditions or La Niña conditions later in the year could mean that Atlantic tropical activity increases to an even more active level than last year.

Witchhazel in winter, Si Griffiths, Commons Wikimedia.

Thank you, gardeners, for another great year!

Most of the United States as well as the rest of the world experienced a warmer climate again in 2023, so gardeners will continue to need to choose plants that are appropriate for their warming climate zones. Extreme conditions, including devastation by individual storms as well as natural climate variability, will continue to affect home gardens through water stress caused by drought and extreme heat as well as damage caused by floods, high winds, and freezing temperatures. Building a resilient garden that can withstand these extremes will allow your garden to thrive through whatever conditions the atmosphere throws at it.

I want to end this year by thanking you all again for your loyal readership and your thoughtful questions and comments on many topics. I encourage you to share your 2023 garden challenges (weather or otherwise) in the comments along with your plans for how you plan to address them in 2024 and beyond. I look forward to reading them! We will see you again in the New Year.

Some lists of top weather and climate events for 2023 (mostly videos):

Weather Nation: Looking Back at the Top 10 Weather Events of 2023

Pattrn: 2023: Year of Extremes

NBC News: The biggest climate stories of 2023

Climate.gov: Climate Highlights of 2023

Atmos Earth: Your 2023 Climate Wins, Wrapped

Edit this at Structured Data on Commons
Frost in tree shadows, Oswald Bertram , Commons Wikimedia

People and Plants

In this late fall edition of People and Plants we’ll take a look at an early American female botanist, Martha Daniell Logan.

Martha Logan’s signature. Courtesy of The South Carolina Historical Society.


She was born in 1704 in St. Thomas Parish, South Carolina, the second child of Robert Daniell and his second wife Martha Wainwright. After her father died in 1718 she inherited his land along the Wando River. In 1719, Martha married George Logan, Jr. and they lived on the Wando River, ten miles from Charleston, where both the Daniell and the Logan families owned extensive property.  Over the next sixteen years, she gave birth to eight children, six surviving to adulthood.  In 1750 the family moved to a plantation near Charleston. Needing to enhance the family income she advertised her services as a teacher but her attention gradually shifted to horticulture. She began her botanical career collecting in the woods near her home.

The title page of the 1757 South Carolina Almanack which contained Martha Logan’s “Gardener’s Kalendar.” Image courtesy of the South Carolina Historical Society, Charleston, S.C.

Martha soon gained the reputation of a skilled gardener and maintained a well-known garden “on the Green, near Trott’s Point in Charles Town.” Gardening became her focus and occupation and she embarked on a career as a “purveyor of botanical goods,” selling seeds and plants from her home. 
In addition to native plants, she dealt in imported specimens. Gardening, especially landscaping with rare plants, had become a favored pastime among wealthy locals and Martha was quick to capitalize on this. An advertisement published in the Gazette on November 12, 1753, announced the availability of “a parcel of very good seeds, flower roots, and fruit stones of several kinds” that were “just imported from London.”

Page of the 1757 South Carolina Almanack print of Martha Logan’s “Gardener’s Kalendar.” Image courtesy of the South Carolina Historical Society, Charleston, S.C.

She exchanged seeds, roots, and plants, like gardeners do, with other botanical enthusiasts including the naturalist John Bartram. His visit in 1760 initiated a three year correspondence and trade of specimens. They swapped lists of available plants and used silk bags to send seeds to each other. They also exchanged lists of plants that each desired from the other’s geographical area. Logan enthusiastically sent Bartram plants from Carolina which “may be New to you” and “be an adision [addition] to yr Collection.” In return, she asked him to send bulbs and double-flowering plants that her London contacts had failed to procure or took too long to send. She shipped and received tubs of cuttings and roots on ships traveling between Charleston and Philadelphia, where Bartram lived. Bartram praised her in a letter to a London friend and wrote, “Mrs. Logan’s garden is her delight and she has a fine one.”

Page of the 1757 South Carolina Almanack print of Martha Logan’s “Gardener’s Kalendar.. Image courtesy of the South Carolina Historical Society, Charleston, S.C.

With the popularity of urban gardening on the rise Martha realized that many people needed help and guidance with their horticultural endeavors. In 1752 her first advice column titled “Gardners Kalander [sic], done by a Lady of this Province, and esteemed a very good one.” appeared in the South Carolina Almanack. Her first publication was so successful she continued to publish her calendar, updating and enlarging it each year.

Page of the 1757 South Carolina Almanack print of Martha Logan’s “Gardener’s Kalendar.” Image courtesy of the South Carolina Historical Society, Charleston, S.C.

Martha continued her business, what we nowadays would call a garden center, for the rest of her life. She even wrote a treatise on gardening at the age of seventy. In 1809 the early Charleston historian David Ramsay described her as “a great florist, and uncommonly fond of a garden,” and claimed she “reduced the knowledge she had acquired by long experience, and observation, to a regular system which . . . to this day regulates the practice of gardens in and around Charleston.”

Page of the 1757 South Carolina Almanack print of Martha Logan’s “Gardener’s Kalendar.” Image courtesy of the South Carolina Historical Society, Charleston, S.C.

Martha died in Charleston on June 28, 1779, and was buried in St. Philip’s Churchyard. She is considered one of the founding gardeners of South Carolina.


Read back through the pages of her 1757 Gardener’s Kalendar shared above. In your opinion, how much of it is still applicable? One bit of her advice that is always appreciated: “What was neglected last month may be successfully done in this.”

5th National Climate Assessment and an Update on the Plant Hardiness Zone Map

This month has been an exciting one for climatologists around the United States with the November 14 release of the Fifth National Climate Assessment (NCA5), a massive project that is undertaken every four years to capture our current understanding of climate change based on recent research. I was a chapter author for the Southeast and spent the last two years working with over 700 authors around the United States to gather and document how the climate is changing and how it is affecting all of us. This week I will explain how NCA5 was put together, what it says about climate, and what gardeners can do to help reduce the future impacts of global warming and other climate changes. But this month was also exciting because USDA just released an updated Plant Hardiness Zone map, just a few weeks after my post in October about how the 2012 map was outdated. I guess they were listening (just kidding!). I will discuss that briefly at the end of this post, too.

Frost on the grass/moss, Timo Newton-Syms, Commons Wikimedia

What is the National Climate Assessment?

The National Climate Assessment (NCA) is a report mandated by Congress to compile the latest scientific findings on how climate is changing so that we can respond to reduce its future impacts. It is published every four years, and the last one (the 4th NCA) was released on the day after Thanksgiving in 2017. While the underlying message has not changed, each assessment focuses on the newest scientific research that has been published since the last assessment was done. The document is divided into chapters so that the authors of each chapter could concentrate on that topic.

NEWS STREAM VI – REFLECTIONS by Taina Litwak as part of the NCA5 art competition (see all entries along with artist statements at https://nca2023.globalchange.gov/art-climate/).

NCA5 starts with a review of the general scientific principles of how the climate is changing. That is followed by seventeen chapters focused on national topics such as agriculture, water, energy, and transportation as well as specific groups that are being especially affected by climate change such as indigenous peoples. Following the national topics, chapters address changes that are happening in ten different regions of the country . These address how we need to reduce future greenhouse gas emissions that are driving the warming of the earth as well as how we can adapt to the changes that are already happening now and may get worse in the future.

How was NCA5 produced?

There is a long process involved in producing a national climate assessment. Teams of scientists from an array of disciplines were chosen as authors for each chapter to write the initial text of the document. To keep the authors on task and within tight word limits, there were lead chapter authors and technical advisors who moderated group meetings where the key messages for our chapter were identified. Initial figures to include in each chapter were drafted by a graphics team or requested from scientific journals. After the first draft was complete it was first reviewed by federal agencies to make sure that their concerns were addressed and then by the public, who provided many additional comments. All of these comments were provided to the chapter authors so they could refine their text and figures for the next draft. In all, the document when through six different reviews and all comments were addressed.

Frost on a borago officinalis flower, Stanzilla, Commons Wikimedia

Where can I read NCA5 and learn more about what it says?

The NCA contains a vast amount of information in its 32 chapters, five appendices, and special topics, so it is hard to summarize. I encourage you to explore the document online to see what it says about your region and special topics of interest like agriculture, land, and ecosystems. A good starting place is the introductory website https://www.globalchange.gov/our-work/fifth-national-climate-assessment, which explains how the report was written and provides links to read the report, attend a webinar on an individual chapter, and see where the figures came from. I also encourage you to explore the excellent interactive atlas developed in conjunction with the report. Many other resources such as podcasts are available, too.

What are some steps that gardeners can take to respond to climate change?

There are two approaches that gardeners (and all of us) need to take to respond to the challenges of a changing climate. We are already dealing with the consequences of trends towards warmer temperatures and more extreme swings in the water cycle such as increases in floods and droughts. Gardeners are adapting to these changes in climate by planting different plants that are better suited to the warmer climate and changing how they manage their gardens using rain gardens, drip irrigation, and other techniques. Adaptation is a key approach that gardeners will continue to need to follow as the climate continues to get warmer and more variable.

In addition all of us, including gardeners, have a responsibility to cut the emissions of additional fossil fuels which are driving most of the warming (mitigation is reducing the inputs to prevent future harm). This will reduce the impacts that our world will have to navigate in the future. Even a small decrease in the emission of greenhouse gases now can prevent the worst outcomes. A prime target for gardeners is the elimination of gasoline-powered equipment like blowers, mowers, and trimmers. These small tools have highly inefficient engines that emit a lot of greenhouse gases as well as air pollutants (and a lot of noise, too). Switching to electric tools and vehicles, composting, adding solar power to houses and businesses, and conserving energy and water (which often uses energy to purify it) through carefully chosen plantings as well as through other methods can also help reduce future warming.

Frosted flower buds, Tony Hisgett, Commons Wikimedia.

What about the new USDA Plant Hardiness Zone map?

I was surprised last week that the USDA had just produced an update to the 2012 map that I discussed last month. In that post, I noted that the 2012 map was already outdated due to the increasing temperatures we have seen in the 21st century. The new 2023 map uses data from 1991-2020, the current 30-year normal period, to identify the current plant hardiness zones for the United States. You can see the new map and zoom to your city at https://planthardiness.ars.usda.gov/. By comparing it to the 2012 map, you will see that more than half the country has increased by half a zone, which correlates to about a 5-degree F increase in the average lowest minimum temperature a location experiences each year. I asked USDA for a map that showed the changes of zone and was provided one by Chris Daly of the PRISM group that put together the 2023 map (below). Areas in tan experienced a half-zone change since the 2012 map. (There are a few areas in the Mountain West where the zones got colder, as shown in green, but these are mostly linked to new datasets that were available for the analysis rather than any changes to the local climate there.)

Science has made it clear that the earth’s climate is changing and that most of the warming we are experiencing is due to burning of fossil fuels. We must learn to adapt to these changes and make sure that all groups can be protected from the worst impacts of the more extreme weather we are likely to experience. But we can also make changes now to reduce those future impacts, and I know gardeners will be part of that solution.

November PDX leaves, Loren Kerns, Commons Wikimedia

Ok–I know something is wrong, but what is it?

Facebook and other social media attempt to help us solve problems.  This group and others seek to inform gardeners and solve problems they are having growing plants.  Looking at queries and posted responses there is so much information missing, leading to wrong and misleading comments in many of these discussions.  I think it is a good idea to reexamine the diagnostic process and how gardeners can solve their own diagnostic questions.

I know there is something wrong with this Ficus but what is it? To diagnose this tree disorder many steps need to be taken to understand the problem

Diagnosis is always the precursor to solving a plant problem. In the world of plant pathology, palliative care (treating symptoms) is often ineffective if the cause of the disorder is unknown. It is amazing how on social media so many cures, fixes, MacGyvers, or treatments are suggested even before a diagnosis is made. The diagnostic process has many components so its good to be familiar with some of the steps in this process.

Identify the plant

All plants have published names and are based on herbarium specimens. The published names of plants are all scientific binomial names. The first name is the genus and second the specific epithet or species.

Host identification comes as the first step in diagnosis. It sounds simple or silly, but knowing the host name is the first step in diagnosis. Find the scientific name of the plant and then specific disorders of that taxa can be sought out in a web search. Common names are misleading and it is critical to associate disorders with the exact plant you have a problem with. If you are diagnosing remotely (as I am often forced to do), knowing the location is the next question as many disorders are regional. For instance we don’t have black knot of plum in southern California while in southern Ontario, Canada and New York state that is a big problem.

Look at the whole organism

So many gardeners only focus on where they see symptoms. A leaf, shoot, or branch with something that does not look right is a good place to start looking, but always consider the entire plant. It is important to see the entire plant and what the distribution of above ground symptoms is. Don’t forget the “whole organism” includes its root system which is often neglected in diagnosis.

Examine the entire plant including its roots for symptoms

Look at all the components of the plant

Symptoms which are plant responses to a disease or disorder often occur on leaves. The problem, however, may be in the roots. Root rots may go undetected until almost the entire root system is decayed; only then do symptoms start to appear on the distal or far portion of the plant. These rapidly or slowly spread until the entire plant is affected. Whenever there is uniform symptomology of the foliage, always check the root system. Symptoms on only a single branch of a perennial may be localized to that branch, so follow the symptomatic branch back to its attachment point to locate any damage or disease along its stem.

Examining stems in the ficus picture above shows clear canker symptoms typical of Botryosphaeria canker in Ficus. The yellowing leaves are a symptom, but not the cause of the disorder.

Look closely

It often helps to use a hand lends to closely observe insects, insect products like webbing, eggs, pupal cases, or frass, or just to validate that there are no insects or their products present. Many many fungi form fungal fruiting bodies in dead stem portions and these look like tiny grains of pepper under a hand lens. A closer view is often helpful in deciding if a problem is localized or system in the plant.

A hand lens can supply 15-25x magnification

Look for symptoms and signs

Symptoms are plant responses to attack from pathogens, insects or abiotic causes such as herbicides, toxic salts, high and low temperatures etc. Symptoms alert the gardener that there is something wrong but may or may not point the way to the cause of the problem. It is also important to look for signs which are parts of the biology causing the problem. Fungal growths, spores, fruiting bodies insects adults and immatures stages of insects and the products they produce and leave behind are all signs. Signs give more direct evidence of the cause of a problem.

Look around

You may not be the only gardener with a plant problem. Look to see if other plants in your garden are similarly affected. If only a single taxa is affected it could possibly be a disease or insect problem. If many different kinds of plants are affected it may be from a non-biological cause–an abiotic disease or environmental disorder. Solving these diagnoses often requires lab work and specific soil or plant sampling

Distortion of new growth is a symptom. it has many causes but the fact that it is occurring on multiple taxa in a single site suggests herbicide toxicity. In this case the culprit is an herbicide called Polaris and the active ingredient is imazapyr.

Seek confirmation

Once you have collected all the the information (symptoms and signs) over the entire plant (including if necessary root symptoms), it is time to put the information to work. Searching on your own, on the internet, is daunting because there is so much misleading information. If you have the scientific name, you can put that in a search engine along with the symptoms and tentative ID of insects or pathogens and then look at all the images that match what you have. Click on the image and check the source of the file. If from an .edu or educational source, it is likely a higher quality of information. Read these first.

Taking samples to a lab or University Extension office is of limited value because they can’t see the entire plant. It’s best to take samples to an expert when you have a good hunch what is going on and you want to confirm it (you should include images of the whole plant if you can). So much money is spent sending random leaf or twig samples to labs and they end up sending information that is misleading or just wrong as far as the diagnosis goes. Thousands of fungi grow on plant surfaces and labs will isolate these, some are pathogens but may not be on your specific plant as pathogens can be quite specific to plants they have a disease relationship with. The lab report comes back with a finding Alternaria spp. This is indeed a pathogen of tomato and many other plants but it is also a very common saprophyte often found growing on dead plant tissues. So lab findings are helpful when they confirm your own suspicions, but often unhelpful when random plant tissues are sent by a gardener that has no idea what is happening. This is true of any lab, university or private. The more information the lab has, the more helpful they can be. And all labs everywhere would prefer to have the entire organism for diagnosis.

Diagnosis is hard. The best diagnosticians are correct (solve the diagnostic problem) about 2/3 of the time. Sometimes diagnosis of a problem can take years. Some diagnoses are never solved. But for most common plant problems you can find answers by intelligently searching the internet and with some help from the “ologists” of University and private diagnostic firms.

This disorder of Lantana camara took over ten years to diagnose. Samples sent to the state agriculture lab were studied for virus and fungal pests. No results came of it. The disorder was finally resolved when flies of the genus Liriomyza spp. were reared from leaves. Lantana Blotch Miner is widely distributed in Southern California only on L. camara.

How accurate is the USDA Plant Hardiness Zone map?

UPDATE: As of 11/15/2023, the USDA has published an updated Plant Hardiness Zone map that covers the 1991-2020 period, which includes a lot of the warmest years on record for the US. This map shows more detail than the old map and generally increases the zones in most areas by maybe a half-category. It also now includes Canada and Mexico. You can see it and read about it at USDA Plant Hardiness Zone Map | USDA Plant Hardiness Zone Map.

One of the first questions a gardener should ask when they are considering adding new plants to their garden is whether the plants can survive and thrive in the weather and climate conditions in their yard. One of the most useful tools for this is the USDA Plant Hardiness Zone designation. It provides a quick snapshot of the coldest weather the location is likely to experience, a key factor for how well the plants will survive in that area.

Purple aster, Patty O’Hearn Kickham, Commons Wikimedia.

What are plant hardiness zones?

Plant hardiness zones are based on the average annual minimum winter temperature at a location. For simplicity the zones are based on 10-degree Fahrenheit ranges. Each zone is further subdivided into “a” and “b” categories for the colder and warmer halves of the range. You can see the temperature ranges listed on the USDA Plant Hardiness Zone Map website, which also includes a link to an interactive map that will help you determine what zone your location is in. My home in Athens GA is listed as being in zone 8a, which has an average annual minimum temperature range of 10-15 degrees F. Linda provided good descriptions of how to use the zones in this blog in 2019 in A Gardener’s Primer to Cold Hardiness, Part 1 and Part 2.  

How accurate is the USDA Plant Hardiness Zone map?

The latest official version of the map was published in 2012 and showed that most areas had experienced a half-zone change to a warmer zone from the previous map because of rising temperatures. There has been no new map since that time but as temperatures have continued to rise it seems pretty clear to me that the current map is outdated. And in fact, even back in 2012 shortly after it was published, Bert Clegg posted an article in this blog showing that the 2012 map was likely already outdated when it was published because it was based on a 30-year average in an era when temperatures are rising and minimum temperatures are rising much faster than maximum temperatures due to increases in humidity and urbanization.

This graph is created from the NCEI Climate at a Glance tool and can be customized to any location in the US if you want to play with numbers for your location.

We need to be a little bit careful with this comparison because the average minimum temperature is not the same thing as the average annual minimum temperature. The average minimum temperature is the average of all the daily minimums in a specified time period, while the average annual minimum temperature is the average of the single lowest daily temperature that occurred each year. You can have a fairly warm winter which still experiences an extreme cold outbreak that has a very low minimum temperature on one or two days. In fact, December 2022 had exactly that situation with the fiercely cold outbreak that occurred right around Christmas across a lot of the eastern United States. The extremely cold air was barely seen in the winter average temperature at all since February 2023 was extremely warm for most of the month and washed out the impact of the extreme cold since it occurred over just a few days in the average. But it certainly caused a lot of damage to plants that were exposed to the frigid air on those few icy days! If the 2012 map was outdated when it was published, it is surely more out of date now after an additional decade with some of the warmest years on record.

How will the plant hardiness zones change in the future?

As global warming continues, the average annual minimum winter temperature is expected to continue to rise. This will result in a northward movement of plant hardiness zones over time. For example, areas that are currently in Zone 6 may become Zone 7 or 8. The rate of change will depend on how fast the earth warms and that depends on how much and how quickly humans respond to minimize greenhouse warming. It would not surprise me if our hardiness zones in most parts of the United States now are at least a half-zone warmer than what is shown on the 2012 map and it could be even greater in some locations. Not all areas of the country (and the world, for that matter) are warming at the same rate, and areas closer to the poles tend to be warming more quickly because of the loss of snow and ice in winter, especially in the Northern Hemisphere.

Fall Foliage, Portland Japanese Garden, Daderot, Commons Wikimedia.

How will the shift in plant hardiness zones affect gardens?

This shift will have a significant impact on gardening and agriculture. Plants that are not adapted to warmer temperatures may struggle to survive. For example, some fruit trees that are currently grown in Zone 6 may not be able to produce in Zone 7 because they require a certain amount of cold weather to set a good flush of blossoms that form the fruit. Warmer winter temperatures will increase the chance of insect pests and diseases surviving over the colder months, leading to more problems in the next growing season. The last spring frost is likely to come earlier and the first fall frost later in the year. This might make some gardeners happy, since they can get out and start planting earlier, but has implications for pollination since the pollinators may not be able to adapt to the changes in the timing of flowering. That would result in less fertile crops and potentially lower yields of vegetables and other crops.

Gardeners and growers will need to adapt to the changing climate by selecting plants that are suited to warmer temperatures. You may already be doing this by choosing varieties and species for your gardens that are listed as being suitable for a warmer Plant Hardiness Zone than the 2012 map suggests. Gardeners may also need to change their planting practices, such as planting earlier in the spring or providing more shade for plants. In addition, changes in precipitation (which are not included in the Plant Hardiness Zones)  also affect what kind of plants you need to put in your garden since drought is likely to increase in warmer conditions at the same time that individual storm events may drop more rain than in previous years.

Of course, this does not negate the effects of local climate variation across your plot of land. Variations in shade, soil, and drainage will continue to affect variations in the microclimate across your garden, as I discussed in my first blog post, The Weather Where You Are. However, the local variations will occur on top of the changes to the overall plant hardiness in your region and global temperature increases are likely to cause much bigger changes to your local climate in the long term.

National Arboretum in October, DC Gardens, Commons Wikimedia.

How many plants are native to urban areas?

Does this look like a deciduous forest ecosystem?

The emotionally-charged native plant debate only seems to be growing. Well-meaning but misinformed decision-makers continue to institute native plant policies with pressure from special interest groups. Most recently, North Carolina’s General Assembly weighed in on the side of emotional appeal rather than research-based information in mandating “that native trees, shrubs, and other vegetation are [to be] used for landscaping at state parks, historic sites, and roadways.”

Roadways seem a less than ideal place for attracting wildlife

Don’t get me wrong – I love native plants and recommend the use of well-suited native plants in gardens and landscapes. I’m co-author of a book that helps gardeners in the Pacific Northwest choose native species that are likely to thrive in their gardens. But the belief that native plants are superior to introduced species in urban and other unnatural areas is just a knee-jerk reaction to the very real environmental and ecological problems we face. It gives believers a false sense of accomplishment in that they can reverse significant threats such as climate change, wildlife extinction, and pollinator decline simply by using native plants rather than introduced species.

Supporters for this native-only policy list the same tired (and false) reasons that native plants are superior to introduced plants. Here are some of those reasons cited in the North Carolina decision, along with my commentary:

“There are many environmental benefits to native plants, and they are much more likely to thrive in our weather and soils” (North Carolina Department of Natural and Cultural Resources Secretary D. Reid Wilson)

  • The concept of nativity is subjective and many scientists argue that such a subjective division makes it difficult to study, much less discuss, the benefits and drawbacks of introduced plants .
  • This post by Dr. Bert Cregg bursts the bubble on some of the native plant superiority myths.
  • Native soils are not the same as compacted, amended, and otherwise disrupted soils found outside natural ecosystems.
  • There is no research to support that native plants thrive in soils that have been disrupted by development and urbanization.
Even native plants will suffer drought stress if they don’t receive sufficient water

“Native plants are adapted to the state’s environment and more likely to thrive, especially during drought.”

  • Roadways, state parks, and historical sites are not natural environments (though some parts of parks and historical sites could be).
  • Plants that can adapt to disturbed environments are most likely to thrive. Some of these are called weeds.
  • Plants that can survive periods of drought have morphological and/or physiological adaptations for doing so. It has nothing to do with their nativity.

“They support pollinators essential to food production and ecosystem health and boost otherwise declining bird populations that depend on insects associated with native gardens.”

  • One of the basic tenets of ecology is that new resources are exploited by existing members of a food web. What happens with one species of insect or bird or plant is not the big picture – ecology is the big picture.
  • This blog post by Dr. Bert Cregg discusses a paper showing that exotic species can grow more quickly than native plants, but they are eaten more by herbivores.
  • This  blog post looks at some of the research on insectivorous birds that contrasts with the claim that native birds require native insects.
  • The most biodiverse landscapes are those with a high diversity of plants. The vertical structure of a landscape, created by the varying heights of trees, shrubs, and other plants, is crucial for bird habitat. I’ve published both a research article and fact sheet on this topic.

“Native plants, especially grasses, are better able to store carbon, thereby reducing greenhouse gases.”

Grasses and trees both belong in a landscape, but trees store more long term carbon than grasses can
  • Native plants have supercharged photosynthesis? There’s a Nobel Prize waiting for someone to demonstrate that.
  • Trees and other long-lived woody plants are best for storing carbon. Certainly not grasses. And the nativity of the woody plants is irrelevant to carbon storage.
Pacific NW native plants like Gaultheria shallon do not thrive in urban sites where environmental conditions are nothing like natural ecosystems

“Native plants provide habitat for birds and other pollinators, are more resilient, and require less fertilizer and other maintenance.” (Brian Turner, policy director at Audubon North Carolina)

  • Birds and plants have complex and often unexpected relationships. This post discusses a review article on the interaction between birds and those plants who depend on them to spread their seeds.

In June 2023, North Carolina’s Department of Cultural and Natural Resources installed a new 100% native plant garden in front of their DNCR headquarters. In comparing the before and after photos of the site, I’ve got a few observations.

  • If storing carbon is important (as stated earlier), then cutting down all those trees and shrubs (which don’t appear to be invasive species) was an interesting decision.
  • Why not just add a native garden to the existing landscape? That would have increased the plant diversity and retained the vertical structure, which is highly important for biodiversity.
  • If we want stable, biodiverse landscapes in our urbanized environment, we must include the use of introduced species – especially trees. 

“This policy is a big win for birds and everyone who cares about North Carolina’s wildlife. It just makes sense. ” (Brian Turner, policy director at Audubon North Carolina).

  • Nope. It’s a big win for dogmatic belief systems.
Vertical structure and plant diversity creates a landscape that appeals to people as well as wildlife

There are many things that we can do in our gardens and landscapes to maximize biodiversity. Spouting false claims about native plant superiority, garden shaming those who don’t eliminate introduced plants, and forcing communities, cities, and states into lock-step on what can and can’t be planted is not part of that process.

Fall is for planting?

Fall is for planting they say when folks talk about shade trees. But is it? When is the best time to plant a tree? In this blog I will cover tree planting times and other particulars, the drawbacks and good points of these decisions.

So is fall the best season to plant a tree? Of course like so many questions it depends on many factors. Where you live (latitude) is a big part of this equation. I reside in Southern California and Southern Arizona. Both mild climes by any standard, but the Arizona property is at a higher elevation (4500ft) and gets cold sooner than the Southern California location. In Alaska, for another example, the planting seasons are much shorter or narrower as the onset of cold weather can be sooner in the calendar.

Nursery Stake Removed, good! Mulch, good! No turf next to tree, good! Air gap between base and stem BAD!

I think it is important to consider things from a “tree perspective”; or when is it best to plant from a tree’s perspective. Planting is not only the act of installing the tree correctly (see other GP blogs posts for correct planting technique) but it is also an acclimatization process. It is a good idea to purchase your tree beforehand and give it time to get used to the temperatures, light levels and water in the new site. Most fall planted trees are in containers or B&B which requires we do root inspections in order to not plant a tree that has root defects. These root inspections include removing all the old growing medium and root washing (search the GP blog for root washing). Locally sources fall planted trees will automatically be acclimated to reduced light and cooler temperatures. In fact if you plant a deciduous tree it may already be preparing to drop leaves. Fall planted trees still need root ball moisture to establish and thus will need some irrigation, but fall is also a time of reduced water use. One benefit to fall planting is that the trees will grow some roots over the winter and be ready for a big growth push in the spring. They will be partially established and take full advantage of longer days, moist soil and warming temperatures.

Root washing exposes root defects and is recommended before trees are planted into landscapes, especially if trees have been container grown. Bare root stock may also require root pruning to fix injured or girdling and circling roots.

What about winter planting? I have a colleague that described in great detail his ambition to move to California and seek academic employment after not getting a $.50/hour raise at his landscaping job during a long stint of chipping ice in Minnesota to plant conifers in frozen ground. My colleague just retired from a nice career in Cooperative Extension, but that winter planting helped him make the move. You can plant trees in frozen soil but winter kill is a thing and the success rate of such efforts is less than for fall planting. In Southern California and other areas of the southwest and southern USA, winter planting is preferred for fruit trees because you have great access to bare-root stock (only in Winter actually) and we don’t contend with frozen soils. If it ends up being a super wet winter (see the previous blog by Pam for insight on that) it can be a problem when newly planted trees sit in saturated soils for weeks on end.

Spring planting is a thing because Arbor Day is in spring and everyone wants to plant trees on Arbor Day right? Spring planting is sometimes limited by availability, bare root stock is usually sold out or moved into containers. I don’t like buying left over stock because the leftovers are often not the best. And, trees may be in a new growth or flowering phase and their root systems are activating.

This leaves summer. In Southern California shade trees are planted all year. Fruit trees planted in summer will be the left overs from winter and again I don’t like left overs, so I generally don’t plant fruit trees then. Subtropicals establish well in warm weather so mangoes, avocados and citrus are easily planted in summer if irrigation is assured.

All container stock, even boxed trees, should be inspected for girdling roots. Planting large trees requires careful monitoring after planting to assure success.

So the harsher the climate, the more restrictive the planting dates, but Fall is still best. In mild climates of southern states you can plant when you want in most cases. But avoiding months with frost is usually helpful as nursery stock often has tender growth. In almost all cases follow your plantings with a generous ring of arborist chips, avoid planting directly in turfgrass and irrigate your tree like it is still in the nursery for the first few weeks until it roots into the native soil. Do not amend the backfill and PLEASE remove the nursery stake at planting. Provide whatever the tree needs to stand upright with loose ties to poles outside the rootzone. Plant trees where they have room to grow and access to sunlight for most of the day. Plant HO!

What a strong El Niño means for winter weather and our gardens

Earlier this spring, I posted an article about seasonal climate forecasting and noted that we expected to see the development of an El Niño after three years of La Niña conditions ended in March 2023. And sure enough, an El Niño was declared in August 2023 and has been strengthening ever since. It has a 71% chance of becoming a strong event by December or January before starting to weaken, as they usually do in spring or early summer. In today’s post, I will remind you all what El Niño is and how it is expected to affect our climate this (Northern Hemisphere) winter and spring. That will affect how our gardens survive the colder conditions and prepare for next year’s growing season.

Autumn season in Butanic Garden 33, Mostafameraji, Commons Wikimedia

Refresher: What is El Niño?

If you are a new reader of this blog, you may be wondering what El Niño is. El Niño and its companion, La Niña, are two opposite phases of an oscillation in atmospheric and oceanic weather patterns linked to the water temperature in the Eastern Pacific Ocean (EPO). When the ocean there is warmer than usual as it is now, rising air over the warm water creates thunderstorms which can affect the movement of global air currents that bring stormy weather to parts of the earth while leaving other areas high and dry. When the ocean there is cooler than normal in the La Niña phase of the pattern those currents shift, changing the expected weather pattern to something quite different resulting in a different pattern of temperature and precipitation than in El Niño . The maps below show how the climate changes globally in an El Niño in the December-February and June-August periods, corresponding to Northern and Southern Hemisphere winters, respectively. The El Niño pattern is linked to a variety of unusual weather phenomena around the globe. The variations in temperature and rainfall are what affect how our gardens grow or rest in preparation for the next growing season.

What is the current state of El Niño and how is it changing?

Right now, ocean temperatures in the EPO are from 1 to 3 degrees C ( 2-5 degrees F) warmer than normal all the way from the west coast of South America all the way west to the International Date Line. This is a large area of very warm conditions that are being heated even more by the trend towards warmer temperatures due to increases in greenhouse gases in the atmosphere. The heated water provides a lot of water vapor to the atmosphere that helps fuel thunderstorms and tropical systems. Normally in an El Niño year the number of tropical cyclones in the Eastern Pacific is larger than the number in the Atlantic because of that pool of warm water. This year the Atlantic has near record-setting sea surface temperatures which are helping to produce one named tropical storm after another (today we are have “Philippe” and “Rina” active in the Atlantic but only through the name “Kenneth” in the Eastern Pacific). Global warming has affected our climate patterns to such an extent that what used to be established El Niño and La Niña patterns are less likely than in previous decades, although there have always been variations from one event to the next.

Autumn in the botanical garden, Mostafameraji, Commons Wikimedia.

What will happen from N. H. winter through spring?

According to the predictions of how the current El Niño will evolve, we can expect the current pool of warm water and the associated global weather patterns to last through at least the April-June period. Since El Niño seldom lasts for longer than a year we are likely to go back into neutral conditions after that and neither El Niño nor La Niña will dominate. This means that over the next few months we can expect the southern part of the United States to be cooler and wetter than normal since in El Niño years the jet stream is positioned over that part of North America. As storms are pushed through the region rainy and cloudy conditions keep daytime temperatures cool as precipitation in the form of rain or sometimes snow or ice falls. In northern parts of the United States extending north into Canada, warm and dry conditions are likely to lead to a lack of snow cover and shorter ice coverage on what are usually frozen lakes. Warmer than normal conditions are also likely to occur in most of Southeast Asia stretching from India to Japan. Drier than normal conditions are likely in the Western Pacific Ocean and in southern Africa as well as South America, leading to the possibility of droughts in those areas.

Autumn garden 3, Jonathan Billinger, Commons Wikimedia

What does this all mean for our gardens the next few months?

In the parts of the world that are under the jet stream, cooler and wetter than normal conditions should lead to high levels of humidity and increases in soil moisture over the winter since evaporation will be low in the cold winter months. That means gardens in those areas should be fairly wet going into spring. That means a spring or summer drought there will be less likely than after a La Niña winter, but it could be muddy working in your garden areas next planting season. Since El Niño is already strong and getting stronger this wet winter pattern may start early this year so don’t dawdle in preparing your fall garden for winter since it might be hard to work in those wet conditions. Soil temperatures may stay cool later in the spring, delaying planting of seeds and vegetables or flowers that require warm ground to germinate and grow.

If you are in northern parts of the United States and up into Canada, you can expect warmer and drier conditions than usual. That could mean a lack of snow cover and loss of some plants that need insulation provided by the snow to survive the winter. Even though temperatures will be overall warmer than in non-El Niño years, there are still going to be cold outbreaks that can cause damage to plants that are over-wintering. The lack of precipitation could also lead to dry soil conditions in spring that could require increased irrigation or hinder the growth of seeds or new seedlings you might plant. The lack of soil moisture could also contribute to the development of drought later in the growing season.

Lurie Garden in late fall, bradhoc, Commons Wikimedia.

Of course, even though El Niño and La Niña are the most reliable predictors for climate several months ahead, there are always other factors that can affect climate patterns too. There is no guarantee we will see these exact patterns this winter and there are sure to be some surprises that we don’t expect.

Electroculture – rediscovered science or same old CRAP?

I’ve been doing horticulture myth-busting for almost 25 years now – and what I’ve learned is that myths are zombies. Not only do myths not stay dead, but new zombie myths are also continually created. One of the newest bright-n-shiny distractions is electroculture. It’s EVERYWHERE.

What is electroculture, you might ask? Well, Jaccard (1939) described it as “the stimulation of growth in plants by means of electricity passed into the atmosphere surrounding them or into the soil in which they are growing.”

There was a surge in research in the late 1800s through the early 1900s, partially due to earlier observations which tied electrical storms to improved plant growth. (Further research determined that lightning fixes atmospheric nitrogen into a solid form (nitrate), which dissolves in raindrops and enters the soil system. This was undoubtedly responsible for the reported improvement in plant growth after electrical storms.)

Scientific interest in electroculture tapered off with advances in plant physiology and the development of commercial fertilizers. Furthermore, the few scientific publications that came from early studies showed no consistent benefit from electroculture:

  • “Favourable results in increased growth and yield have been obtained from time to time, but they are uncertain and largely dependent on weather conditions.”
  • “Plants on poor soil are little influenced, since electricity…does not provide either nutrients or energy.”
  • “A current of 10 milliamps inhibited growth in 5 plots, but in 10 others yields increased.”
  • “Electroculture experiments produced no differences in the treated trees in growth or yield.”

In the 21st century, a desire to use fewer chemical fertilizers has spurred renewed interest in electroculture. There are vast numbers of websites proclaiming improved plant growth from sticking copper wires in the ground. None of these are backed with any reliable evidence, but proponents argue that new research (since 2000) supports this practice.

I did a search of the scientific literature through AGRICOLA, CABI, and Web of Science/BIOSIS. There were zero publications after 1968. However, Google Scholar lists several. Google Scholar searches for publications in any form on the internet that have been authored by scientists. Here’s an example of what you will find:

  • A 2021 conference report for the IEEE 13th International Conference on Humanoid, Nanotechnology, Information Technology, Communication and Control, Environment, and Management (HNICEM).”
  • A 2021 Research Centre Lab report from the Late Ramesh Warpudkar ACS College Sonpeth, India.
Another wasted sticky-note

These are not peer-reviewed, scientific journal publications. Even earlier ones from the 1980s are in irrelevant journals such as Journal of Biological Physics. Plant scientists publish in plant science-related journals. Researchers outside the field of plant sciences really have no clue how plants function, nor do they have the expertise to design experiments which consider the variables that affect research in applied plant sciences.

Yet, proponents of permaculture push this concept without evidence, using anecdotes as equivalents to scientific data. Conspiracy theories abound, with accusations that chemical companies have forced scientists to cease electroculture research.

Proponents of electroculture “rely on theories of geobiology and use light devices, antennas, or magnets intended to act on the cosmo-telluric electromagnetic fields of the universe, as in dowsing (Wikipedia).”

Worldwide, scientists consider electroculture to be a pseudoscience, particularly because it does not propose any plausible scientific mechanism to explain how electricity would stimulate plant growth.

Take that electroculture!

If and when this changes – when recognized plant science experts publish positive results that are confirmed by other plant researchers – those results will be in bona fide plant science journals and be worth discussing. Right now, don’t waste your time with another horticulture myth that refuses to die.

If you are interested in honing your BS detector, please take advantage of this peer-reviewed Extension Bulletin.
My thanks to Sylvia Hacker for finding great vintage photos to help illustrate this post.

The Fascinating Phenomenon of Fasciation

You may have seen it on the odd flower or plant here and there or you may be intentionally growing plants that show this unique and uncommon phenomenon. Fasciation (not fascination- though it certainly is pretty fascinating) is a malformation or abnormal pattern of growth in the apical meristem (growing tip) of plants. The apical meristem is undifferentiated tissue that triggers the growth of new cells (which extends roots and shoots, and gives rise to stems, leaves, and reproductive structures). In the case of fasciation (which originates from the Latin ‘fascia’ which means ‘band’ or ‘bundle’), this new growth is abnormal and often appears as flattening, ribboning, swelling, fusion, or elongation of plant parts. Sometimes referred to as ‘cresting’, this can occur anywhere on the plant but is more likely to be seen in stems, flowers, and fruit. You might encounter this as several stems growing together, a multi-headed or misshapen flower, perpendicular or irregular growth, dense tuft-like growth, or coiled, contorted, and twisted stems which can sometimes have an unusually high concentration of leaves and flower buds.

A fasciated hinoki false cypress ( Chamaecyparis obtusa ) (Photo: Anton Baudoin, Virginia Polytechnic Institute and State University, Bugwood.org )

There are multiple patterns of fasciation that can be observed, including: linear fasciation (which results in the more common flattened and ribbon-shaped stems), bifurcated fasciation (when a linear fasciation splits in two to form a “Y” shape), multiradiate fasciation (where the stems split into three or more short branches, referred to as a ‘witches’ broom’), or the rare ring fasciation (where the growing point folds over to form a hollow shoot) (Geneve, 1990).

A ribbon of fasciated stems (Photo: Joy Viola, Northeastern University, Bugwood.org )

Fasciation is a symptom that can be caused by a variety of different factors including genetics, hormones, pathogens (including bacteria, viruses, and phytoplasmas), injury (including chemical, mechanical, and feeding damage), nutrient deficiency, or environmental causes (such as temperature extremes) though in many cases it is still not completely understood and the exact cause may not be apparent in a specific fasciated plant. The stability of this phenomenon is also pretty variable. Some plants can pass on this trait through their seeds (resulting in a genetic likelihood of expressing this symptom), while other plants can develop fasciation (through a variety of causes) and then resume normal growth from a fasciated point, or perennial plants that appear fasciated one year may be completely normal the next year. Scientists have even identified some of the specific genes in which mutation can cause fasciation and have experimentally reproduced this result in seedlings that were exposed to radiation, chemical mutagens, and high temperatures.

Fasciated Gaillardia showing unusual growth in the stems and flowers (Photo: Department of Plant Pathology , North Carolina State University, Bugwood.org )

Most often fasciation is just an aesthetic anomaly, is fairly uncommon, and rarely impacts the survival of affected plants (especially if they are established woody plants). In cases of fasciation due to infection by certain pathogens (such as the bacterium Rhodococcus fascians), it is possible for affected plant parts to die prematurely. Although infectious fasciation can spread to other susceptible plants, in the majority of cases fasciation is not infectious and will not spread.

Fasciated asparagus (Photo: Mary Ann Hansen, Virginia Polytechnic Institute and State University, Bugwood.org )

Although fasciation can occur on any plant (and has been documented in hundreds of plant species) it is more frequently seen in certain groups such as cacti, daisies, asters, legumes, willows, and plants in the rose family (Rosaceae). It is also more common in plants with indeterminate growth.

Crested saguaro cactus (Carnegiea gigantea) (Photo: Joy Viola, Northeastern University, Bugwood.org )

In some cases, distinct examples of fasciated plants are intentionally selected for their visual appeal and interest. Many times, plants that have a greater propensity for fasciation, or those that can be vegetatively propagated are developed into cultivars that can be sold (and are often a striking addition in any garden). Many of our dwarf conifers, for example, are propagated from witches’ broom cuttings. In addition, some of our large and uniquely shaped tomato varieties, such as beefsteaks, are selected for their fasciated fruit, and many strawberries that have a wider shape or appear to be ‘fused together’ are also fasciated and considered desirable.

Beefsteak tomatoes are a common example of desirable fasciated fruit. (Photo: Lufa Farms, Wikimedia Commons)

Examples of plants that frequently exhibit fasciation, including those with cultivars that you can purchase for your gardens, are ‘cockscomb’ celosia (Celosia argentea var. cristata), ‘fascination’ culver’s root (Veronicastrum virginicum or sibiricum ‘Fascination’), ‘crested’ hens and chicks (Sempervivum spp. var. cristata), and Japanese fantail willow (Salix sachalinensis ‘Sekka’), among others.

Fasciated cockscomb (Celosia argentea var. cristata) (Photo: Julia Scher, Cut Flower Exports of Africa, USDA APHIS PPQ, Bugwood.org )

If this strange growth is something you don’t enjoy, you can prune out the distorted tissue. Or if you’re like me – you can just marvel at the weird and the wonderful!

Fasciated Yucca flower stalk (Photo: USDA Forest Service – Rocky Mountain Research Station – Forest Pathology , USDA Forest Service, Bugwood.org )

Resources

Fascinating Fasciation (Wisconsin Master Gardeners):
https://mastergardener.extension.wisc.edu/files/2015/12/fasciation.pdf

Plant of the Week: Fasciated Plants (University of Arkansas):
https://www.uaex.uada.edu/yard-garden/resource-library/plant-week/fasciated-2-22-08.aspx

The Genetics of Fasciation:
https://trinityssr.files.wordpress.com/2016/06/4th-ape.pdf

Fasciation (University of California IPM)
https://ipm.ucanr.edu/PMG/GARDEN/FLOWERS/DISEASE/fasciation.html

Fascinated with Fasciation (Dr. R. Geneve, 1990, American Horticulturist)
https://ahsgardening.org/wp-content/pdfs/1990-08r.pdf