This week is the end of 2021 and the start of the new year. What a year 2021 has been! Without even talking about politics, COVID-19, sports, or the economy, it was certainly one to remember from the standpoint of weather and climate. No matter where you live, you probably saw some extreme weather during the past 12 months.

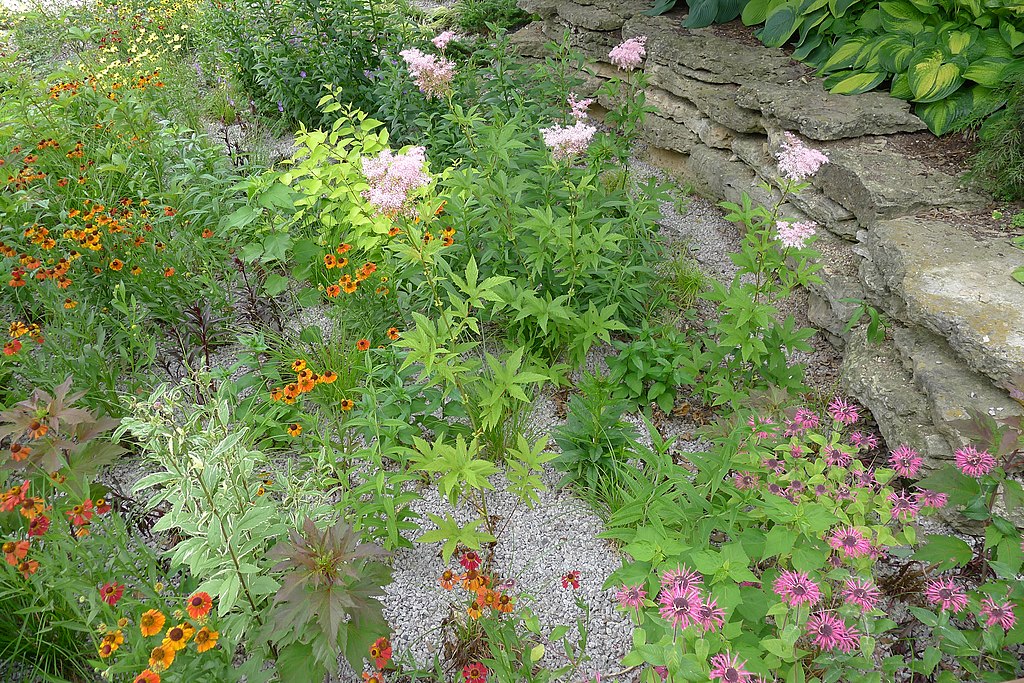
Exploding flower bed fireworks, Eric Kilby via Commons Wikimedia.
Extreme weather in 2021
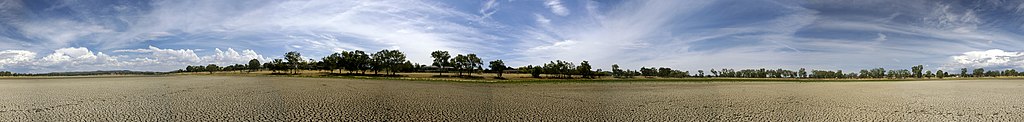
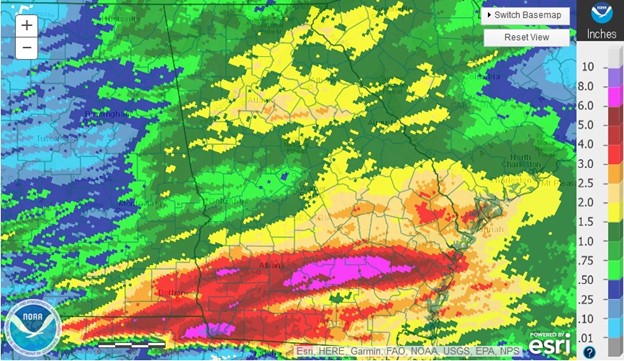
In the United States, the map below shows just the 2021 billion-dollar disasters through October 8. That does not include the tornadoes that ravaged the Midwest, including Mayfield KY, in early December or the fires that burned through the suburbs between Boulder and Denver CO, earlier this week, since those losses have not yet been tabulated. This also does not include the terrible disasters that happened in other parts of the world, such as the devastating spring frost in France’s wine country or the awful flooding in parts of Germany and Belgium last summer. While there is no doubt that a warming climate is partially to blame for many of these disasters, we are also putting ourselves in harm’s way by building in areas that are prone to flooding, wildfires, and other natural hazards that can lead to human disasters. Even if the climate were not changing, we are making matters worse by putting ourselves at higher risk in the way we build and develop land.

Looking back over last year’s climate
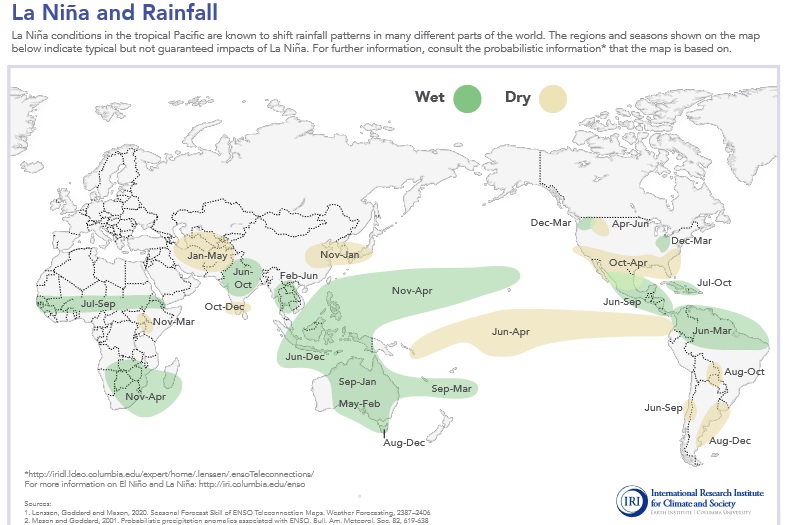
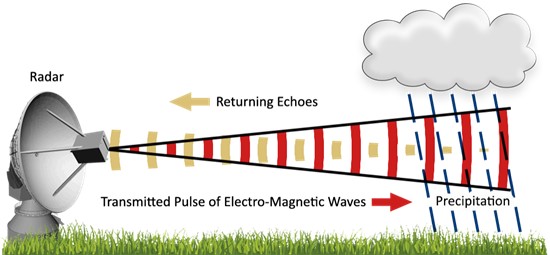
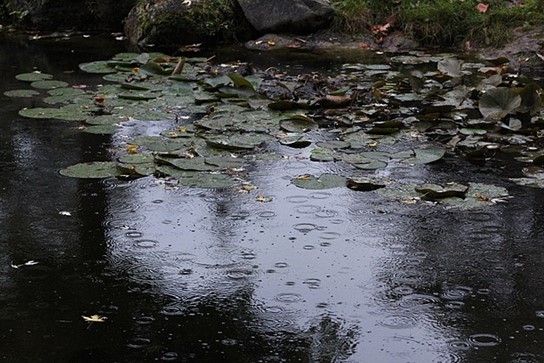
Climatologists are generally very busy this time of year, since everyone (especially the media) wants to know how the year that just ended compared to previous years. While it usually takes a few days for the preliminary data to be complete, and a few months before the final quality-controlled data are available, we can take a quick look at the past year using online tools like the High Plains Regional Climate Center’s ACIS Maps that compile climate information into simple displays. The map below shows the percentage of normal rainfall for 2021 across the contiguous United States. As usual, there are areas with very wet conditions and areas that received less than a quarter of their expected precipitation. Sometimes those areas are not very far apart—just compare southern California with Arizona right across the border. Does the map agree with what you experienced?

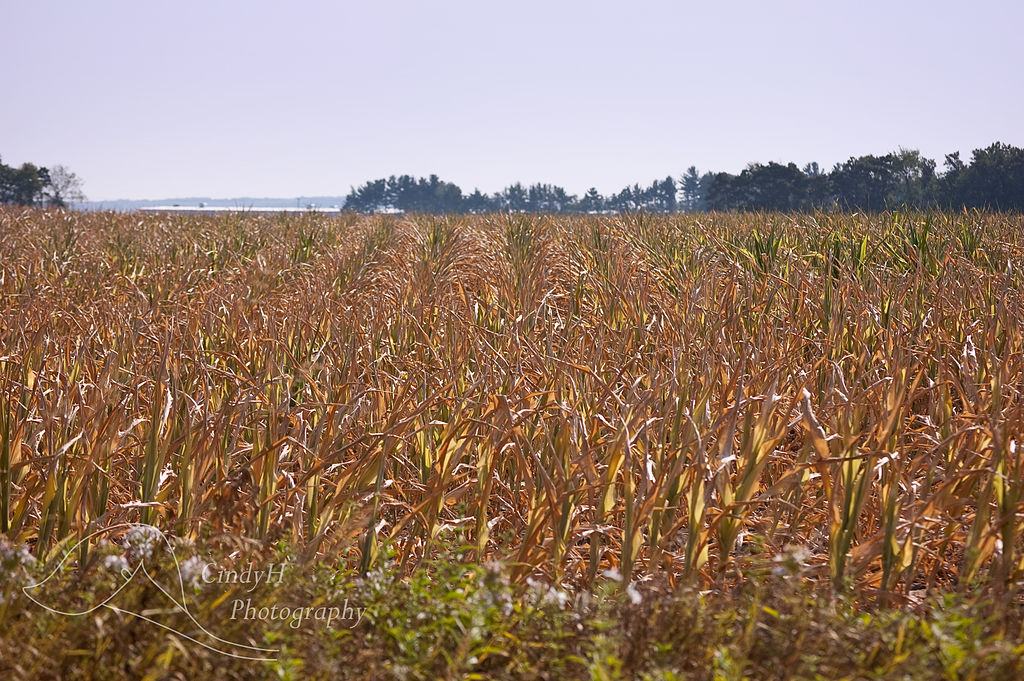
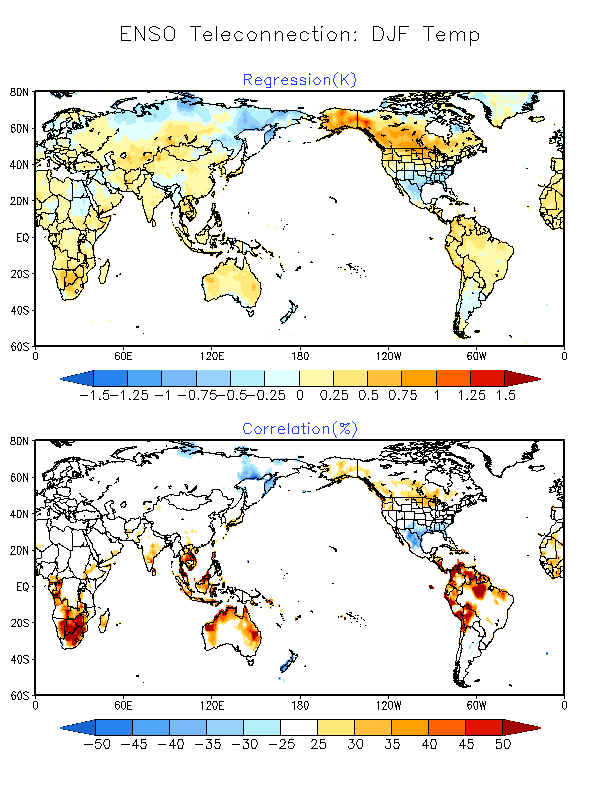
If we look at the temperature map below, it shows that very few areas in the United States were colder than normal temperature. What makes this particularly concerning is that our normals were just updated this year, as I discussed in an earlier blog post. Because the temperature trend across the United States is upward, not flat, we can expect to see more years above than below normal in the future. This is leading to concerns about increased water and heat stress on gardens and gardeners who are working outside as well as damage to natural ecosystems not adapted to the warmer temperatures.

Reviewing your garden in 2021
New Year’s is a great time to evaluate the past year and plan for the next twelve months in your garden, too. If you have the chance, take a walk through your garden and see how it looks (of course, that assumes it is not covered by snow). How did your plants, shrubs, and trees do this year? Are new plantings well established, or do they need to be moved or replaced? Are your new trees correctly planted and growing well? Are you maintaining soil health and moisture with appropriate surface cover? If not, there is plenty of advice on how to correct problems in this blog—just do a search to find information that is based on current science, not hype. It’s also a great time to think about what you will be doing with your garden in the coming year. Perhaps the warmer temperatures will allow you to try new plants that you have not been able to grow before. I know many of you are already looking at the new seed and garden catalogs for next year, so dream away!
Don’t forget to prepare for bad weather, too
In addition to your planning for next year’s garden, don’t forget to prepare for extreme weather, too. Have a plan for where to go when severe weather threatens, and how to contact each other if you are away from home when it strikes. Keep an eye on weather forecasts so you know when conditions are likely to threaten. Have multiple ways to get severe weather warnings, including a NOAA weather radio and a cell phone that is charged and ON with the volume turned up and an appropriate warning app or two loaded. Don’t count on an outdoor siren to wake you up—they are not designed to warn people indoors. Get helmets to protect your heads from falling or flying debris if you can. Make an inventory of your household goods and store it somewhere safe (a good idea for any disaster, not just a weather event).
See you in 2022!
I’ve enjoyed sharing some of my weather and climate knowledge with you over the past few months and look forward to continuing this in 2022. I’ve also learned a tremendous amount from my co-authors and know that you have, too. Enjoy the rest of your winter holidays! I hope that your 2022 is beautiful, safe, and productive for all of you and your gardens too.