If you’ve been around as long as I have, you will no doubt remember the Creedence Clearwater Revival song “Have You Ever Seen the Rain”. This week I want to talk about sensing the rain using radar and how you can use it to provide you with local rainfall information if you don’t have a rain gauge of your own.
How does radar work?
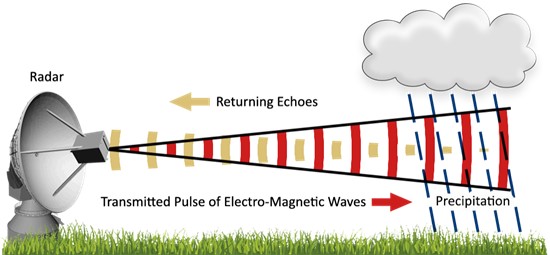
Radar is what scientists call an active sensor, because it sends out a beam of electromagnetic radiation that is reflected back to the radar if it hits something reflective like raindrops or hail (it also works on birds, insects, and cars traveling along interstates, but that’s another story). By detecting how much of the original beam is returned and how long it takes to get back, the radar can determine how much precipitation there is and how far away it is falling. The radar emitter usually rotates around a circle to provide a 2-dimensional picture of the precipitation in the area around the radar instrument. They can make it 3-dimensional by tilting the radar up at different angles to see different levels in the atmosphere. Now, the newest doppler radars used by the National Weather Service can also sense the size of the falling particles and how fast they are moving towards or away from the sensor. The radar displays that are usually used on television or online show a color-coded map with the brightest colors corresponding to the highest radar returns and thus the heaviest rain rates.
Radars can be used to estimate rainfall, but some assumptions must be made about the rain to get a good estimate. The major estimate that is needed is what size or sizes are the raindrops and how many of them are present. That will allow the radar software to calculate the volume of water that is falling and relate it to the strength of the return “echo” of the radar beam.
But how do they know the distribution of raindrop sizes in a rainstorm?
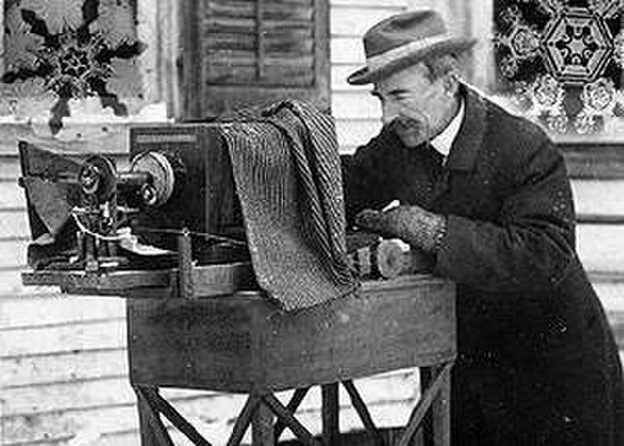
I learned this week in a video on raindrop shapes that the first person to measure rainfall size distributions was William Bentley, a citizen scientist in Vermont who is best known for his spectacular photographs of snowflakes. Bentley used a tray filled with a shallow layer of flour and exposed it to falling rain. The drops landed on the flour and dried into balls that provided a measure of how the size of the drops varied in the storm. Of course, now there are more sophisticated ways of determining this using optical sensors and other devices, but this was surprisingly good for its time.
Today, by measuring the amount of radar emissions returned to the sensor and calibrating it to rain gauge measurements at the surface, atmospheric scientists have been able to provide good estimates of the rain falling across the region that the radar is able to sense. That is usually within about 120 miles before the radar beam overshoots most of the rain clouds due to the earth’s curvature. Fortunately, with a network of radars across the country, we can get a pretty good estimate of rainfall that is spatially much more detailed than we can get with a network of surface observers from the National Weather Service, state networks like the agricultural weather network I manage at the University of Georgia, or the volunteer corps of observers in CoCoRaHS (for more on this network, see https://gardenprofessors.com/the-weather-where-you-are/). That allows us to have a pretty good sense of how the rain is varying across fairly short distances and provides a reasonable estimate of the rain at your house if you don’t have a rain gauge available.
Radar-estimated rain where you are
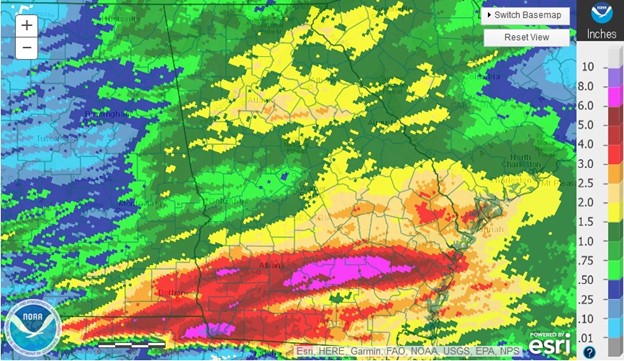
To find the rainfall estimates for your location, the easiest way to do it is to use the National Weather Service’s Advanced Hydrologic Prediction Service. This website provides a daily rainfall amount based on radar estimates for the period currently from 8 AM EDT on the previous day to 8 AM on the day of the map. They are usually available an hour or two after that time period ends so they can receive the data and perform quality control before releasing the maps. You can zoom in on the maps to your location and add county outlines or other backgrounds to help pin it to your exact location. The site also allows you to look at 7-day, 14-day, and longer accumulation periods and to compare those to normal or expected precipitation. The map below is one I created for a heavy rain event in Georgia this past week on April 25, 2021, where a few locations in southern Georgia got up to 10 inches in just a few hours, causing problems for farmers there due to standing water, erosion due to runoff, and scattered loss of seed and fertilizer.
The radar maps are not perfect. You can only zoom down so far, and the smallest unit is still at least a few kilometers or miles on a side, so you will never be able to distinguish the exact edge of a summer thunderstorm that drops rain on one side of the road and leaves the other side dry. The estimates also tend to be too low in high-intensity rainfall because the relationships that the radar software uses to estimate the volume of water don’t work very well when it is raining harder than normal. But by calibrating the rainfall to observers’ reports, they are usually pretty reasonable. If you are not in the United States, you will need to check with your own nation’s weather service to see what radar information is available.
Coming in May…
Speaking of “normal”, in May NOAA is expected to update the normals for temperature and precipitation for the US from the 1981-2010 values to the 1991-2020 values. The new temperature values will be higher than the previous ones due to the upward trend in temperature in the US and the globe over time. Rainfall will also change but it will go up in some places and down in others due to wet and dry spells in different parts of the country over time. I will talk about the new normals and how they are created in my blog post in late May.
Hi Pam, As an ISA Board Certified Arborist, horticulturist, NWS cooperative observer, CoCoRaHS weather observer, and overall weather and tree nerd, I am understandably enjoying your addition and contributions to the Garden Professors blog. Great information!