“Have you ever seen the rain?”

If you’ve been around as long as I have, you will no doubt remember the Creedence Clearwater Revival song “Have You Ever Seen the Rain”. This week I want to talk about sensing the rain using radar and how you can use it to provide you with local rainfall information if you don’t have a rain gauge of your own.

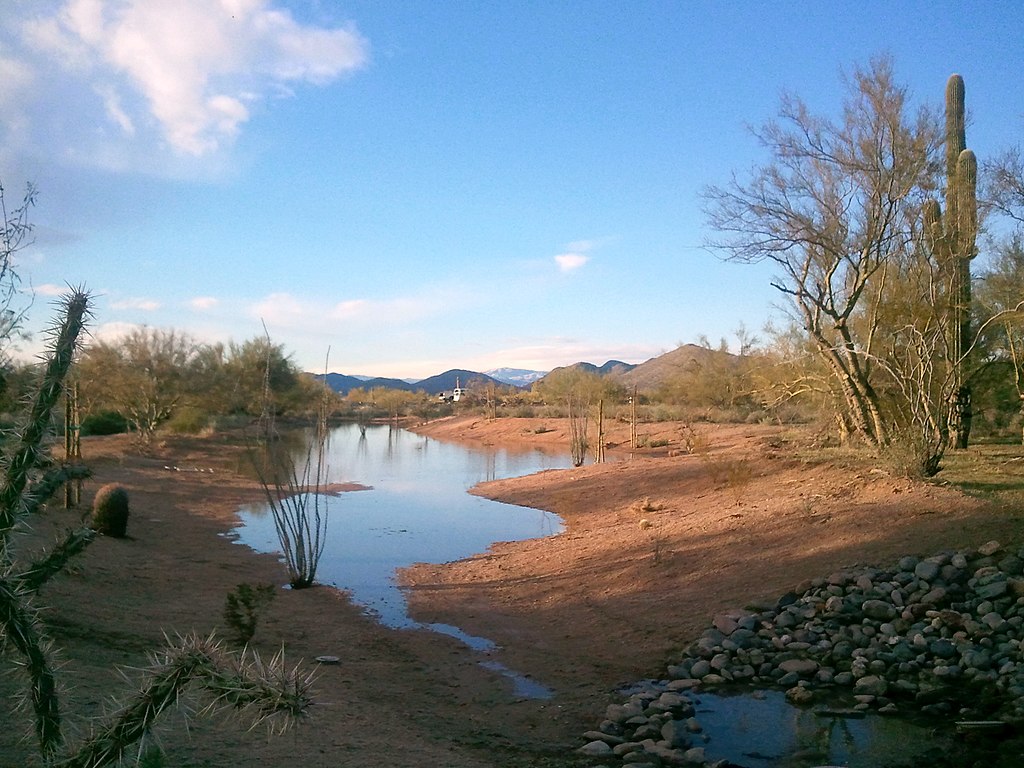
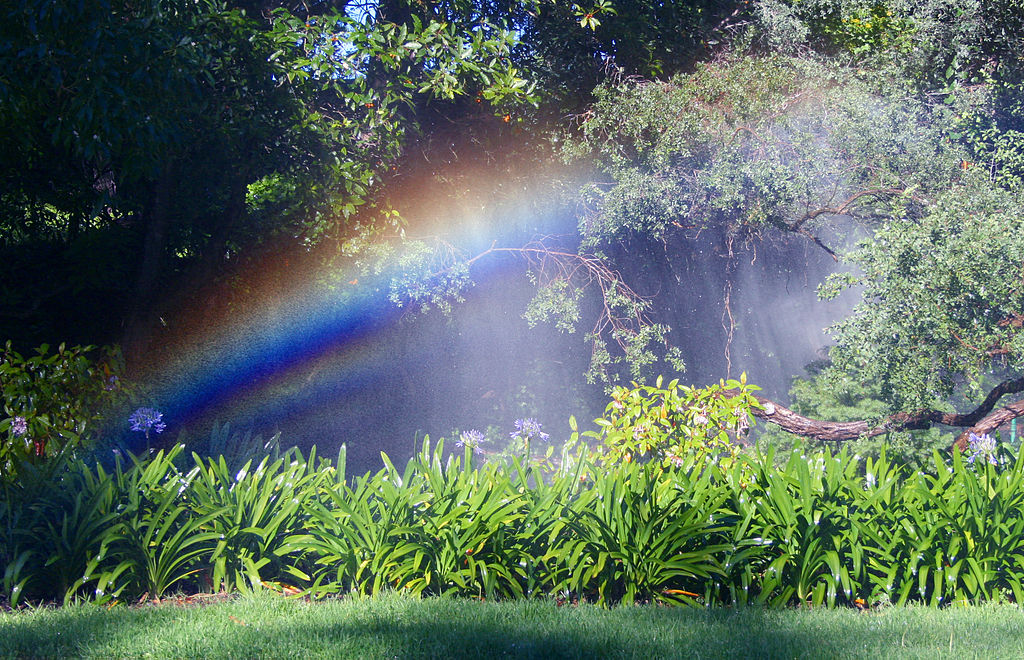
Source: Brocken Inaglory, Creative Commons

How does radar work?

Radar is what scientists call an active sensor, because it sends out a beam of electromagnetic radiation that is reflected back to the radar if it hits something reflective like raindrops or hail (it also works on birds, insects, and cars traveling along interstates, but that’s another story). By detecting how much of the original beam is returned and how long it takes to get back, the radar can determine how much precipitation there is and how far away it is falling. The radar emitter usually rotates around a circle to provide a 2-dimensional picture of the precipitation in the area around the radar instrument. They can make it 3-dimensional by tilting the radar up at different angles to see different levels in the atmosphere. Now, the newest doppler radars used by the National Weather Service can also sense the size of the falling particles and how fast they are moving towards or away from the sensor. The radar displays that are usually used on television or online show a color-coded map with the brightest colors corresponding to the highest radar returns and thus the heaviest rain rates.

Source: Environment Canada

Radars can be used to estimate rainfall, but some assumptions must be made about the rain to get a good estimate. The major estimate that is needed is what size or sizes are the raindrops and how many of them are present. That will allow the radar software to calculate the volume of water that is falling and relate it to the strength of the return “echo” of the radar beam.

But how do they know the distribution of raindrop sizes in a rainstorm?

Source: Jason Zhang, Creative Commons

I learned this week in a video on raindrop shapes that the first person to measure rainfall size distributions was William Bentley, a citizen scientist in Vermont who is best known for his spectacular photographs of snowflakes. Bentley used a tray filled with a shallow layer of flour and exposed it to falling rain. The drops landed on the flour and dried into balls that provided a measure of how the size of the drops varied in the storm. Of course, now there are more sophisticated ways of determining this using optical sensors and other devices, but this was surprisingly good for its time.

William Bentley, photographer (public domain)

Today, by measuring the amount of radar emissions returned to the sensor and calibrating it to rain gauge measurements at the surface, atmospheric scientists have been able to provide good estimates of the rain falling across the region that the radar is able to sense. That is usually within about 120 miles before the radar beam overshoots most of the rain clouds due to the earth’s curvature. Fortunately, with a network of radars across the country, we can get a pretty good estimate of rainfall that is spatially much more detailed than we can get with a network of surface observers from the National Weather Service, state networks like the agricultural weather network I manage at the University of Georgia, or the volunteer corps of observers in CoCoRaHS (for more on this network, see https://gardenprofessors.com/the-weather-where-you-are/). That allows us to have a pretty good sense of how the rain is varying across fairly short distances and provides a reasonable estimate of the rain at your house if you don’t have a rain gauge available.

Radar-estimated rain where you are

To find the rainfall estimates for your location, the easiest way to do it is to use the National Weather Service’s Advanced Hydrologic Prediction Service. This website provides a daily rainfall amount based on radar estimates for the period currently from 8 AM EDT on the previous day to 8 AM on the day of the map. They are usually available an hour or two after that time period ends so they can receive the data and perform quality control before releasing the maps. You can zoom in on the maps to your location and add county outlines or other backgrounds to help pin it to your exact location. The site also allows you to look at 7-day, 14-day, and longer accumulation periods and to compare those to normal or expected precipitation. The map below is one I created for a heavy rain event in Georgia this past week on April 25, 2021, where a few locations in southern Georgia got up to 10 inches in just a few hours, causing problems for farmers there due to standing water, erosion due to runoff, and scattered loss of seed and fertilizer.

Radar-estimated rainfall for 24 hours ending at 8 am EDT on April 25, 2021.

The radar maps are not perfect. You can only zoom down so far, and the smallest unit is still at least a few kilometers or miles on a side, so you will never be able to distinguish the exact edge of a summer thunderstorm that drops rain on one side of the road and leaves the other side dry. The estimates also tend to be too low in high-intensity rainfall because the relationships that the radar software uses to estimate the volume of water don’t work very well when it is raining harder than normal. But by calibrating the rainfall to observers’ reports, they are usually pretty reasonable. If you are not in the United States, you will need to check with your own nation’s weather service to see what radar information is available.

Coming in May…

Speaking of “normal”, in May NOAA is expected to update the normals for temperature and precipitation for the US from the 1981-2010 values to the 1991-2020 values. The new temperature values will be higher than the previous ones due to the upward trend in temperature in the US and the globe over time. Rainfall will also change but it will go up in some places and down in others due to wet and dry spells in different parts of the country over time. I will talk about the new normals and how they are created in my blog post in late May.

Where to find spring frost dates and the mystery of Southeastern frost trends

Most gardeners this time of year are thinking about the last frost dates for their locations and how soon they can get out into their garden plots. Here in the Southeast, many areas have already passed their last frost or will soon, while in other parts of the country, it may be many weeks before the threat of frost is over. In this week’s column, I want to describe a way to get frost dates for your location and discuss the mystery of why the date of the last spring frost is getting later in the Southeast in spite of temperatures that are rising across the country.

Frosted kale. Source: Tracey from North Brookfield, Massachusetts, USA, Commons Wikimedia.

Resources for finding your frost date

There are many places that you can go to find information on the average date of the last spring frost. Many gardening guides publish them, and John Porter had an excellent discussion of last frost and planting dates a year ago, including a number of sources of information and a map for the continental United States.

You can also look at frost dates for individual locations using xmACIS, an online free database that allows you to list yearly last spring and first fall frost dates and the growing season length. This database contains observations taken by National Weather Service cooperative observers and is incorporated into the NOAA 30-year averages (normals) that John mentioned in his posting. You might find it helpful to see not only the average but also the variability from one year to the next at whatever station is closest to you. (Here is a quick reference sheet for xmACIS.) Of course, there are other places to get this data in a variety of formats, but xmACIS is quick and easy and works for the whole country, which is an advantage for all our readers.

To access data near you,

  1. Go to the top under Single Station and choose “First/Last Dates.”
  2. Under Options Selection choose:
    1. your preferred output, (Graph, table or CSV)
    1. Year range (POR is period of record, which will vary depending on which station you choose)
    1. Under Criteria set minimum temperature at less than or equal to 32 F (or another threshold for a special crop)
    1. Period beginning (for spring frost dates, usually July or August)
    1. Pair results (for spring frost dates, usually by Calendar year)
  3. Under Station Selection, you can find a station by ID if you know it, by choosing from the list or searching by zip code. Or change your CWA (National Weather Service County Warning Area) to your local region and available stations in that area will be listed. A map of the CWAs is shown below. Pick the station that is closest to you to get the best data for your location.
  4.  Hit “Go” and you will get a list of the yearly last and first frosts of the growing season. The average date is at the bottom.

National Weather Service office identifiers.

Climate change and frost dates

With increasing temperatures due to global warming, you might wonder how these frost dates are changing over time. As temperatures get warmer, you might expect that the average date of last spring frost would be getting earlier in the year over time and the average date of first fall frost would be getting later. And this is generally true in most of the US, with the exception I will discuss in a minute.

I did some work with Melissa Griffin of the South Carolina State Climate Office in the past, and we determined that a 1-degree F rise in average temperature over time corresponded roughly to a 1-week increase in the length of the growing season. That is an important statistic for farmers, who plan what to plant depending in part on how long the growing season is. If the temperature in the US goes up 4 F by the year 2100, then we can expect that the growing season would increase by generally four weeks or one month, although that will vary from place to place.

Southeast frost date mystery

In most places in the US, the date of last spring frost is getting earlier in the year, as expected. But there is one regional exception, and that is the Southeast, especially in Georgia and to a lesser extent, Alabama. You can see this in the once-again public EPA climate change page.

It is not clear why this trend towards a later spring frost date is occurring in the Southeast. One theory is that perhaps a local weather phenomenon we call “the wedge” is changing due to alterations in weather patterns across the region as the global temperature increases. “The Wedge” is a thin, dense layer of cold air which moves southeast along the eastern edge of the Appalachian Mountains, bringing cold air and cloudy conditions to that region.

A group of University of Georgia students and I looked at this “wedge theory” in 2020. We tried to identify where the wedge of cold air was most likely to be occurring in the Spring and correlate those areas with changes in frost date. So far, the results have been inconclusive. More research will be needed to figure out why this odd pattern is occurring now and whether it will continue in the future. 


Air temperature on February 20, 2019, from the University of Georgia Weather Network, showing the cold “wedge” of air in northeastern Georgia.

Implications for home gardeners

Knowing your average spring frost date can be an important brake on most gardeners’ eagerness to get back out in the garden in spring. Who hasn’t wanted to start planting on the first warm and sunny day? But if you know that more frosts are likely based on the local climate, you may be willing to wait to get started until your plants are safe from cold damage. Then the real growing season can begin!

Why seasonal climate forecasts aren’t always accurate

Do you use predictions of seasonal climate to plan your garden work? Or are you frustrated because they don’t seem to be very useful? I’ve been getting a lot of complaints this year about how bad the climate forecast for winter was because what we have seen so far has not matched the predictions in many parts of the country. Let me take a few minutes to explain how they are made and what you can learn from them.

First, let me specify that I am not talking about long-range climate forecasts for 50 years down the road. Nor am I talking about weather forecasts for the next week. I am talking about the forecasts that cover the period from about 15 days to 3 months, which climatologists call the “seasonal to sub-seasonal forecasts”. These are the kinds of forecasts that say “Winter is likely to be warmer and drier than normal” or “Get ready for a big warm-up in the next month.” They can be useful in planning garden work a few weeks ahead, but they come with caveats.

“Glory of the Snow” in the snow. Taken by User:Ruhrfisch April 2006, Commons Wikimedia.

Unlike weather forecasts, there are only a few models that predict climate in the monthly to seasonal time period. That is because we can’t just run the weather models out four to twelve weeks and expect to get anything like real weather. The weather models are built to handle short time steps and detailed information about temperatures, rainfall, and all the other factors that make up your daily weather, and to do it fast enough that you can actually use the forecast to decide when to wear your raincoat. They are useful out to about a week, but then their accuracy starts to break down because there are too many things going on around the globe to capture accurately over time, and so the short-term models tend to drift away from reality the farther from “now” you get. Models for monthly to seasonal climate tend to be based not on dynamical atmospheres like weather models but on statistics.

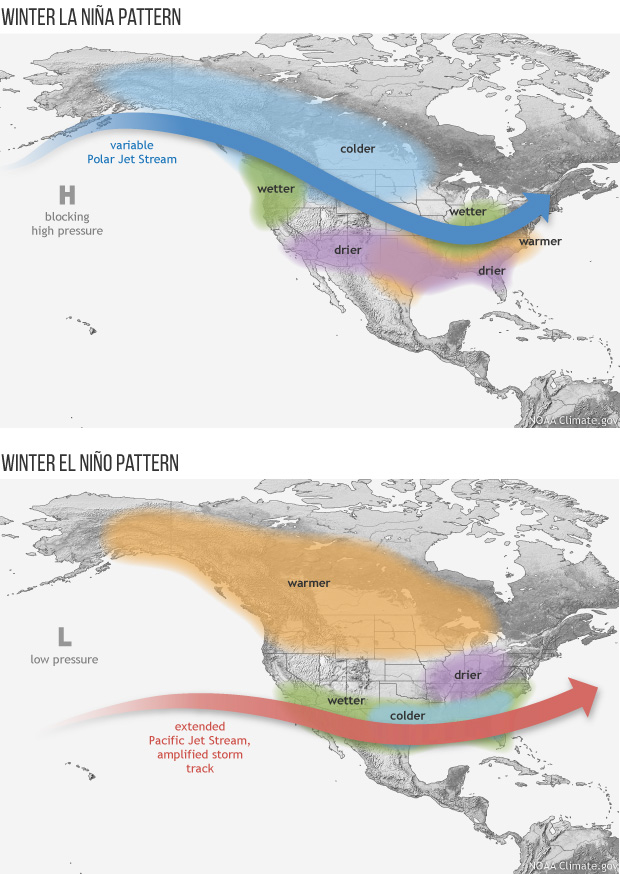
La Nina causes the jet stream to move northward and to weaken over the eastern Pacific. During La Nina winters, the South sees warmer and drier conditions than usual. The North and Canada tend to be wetter and colder. Source: https://oceanservice.noaa.gov/facts/ninonina.html)

NOAA’s Climate Prediction Center (https://www.cpc.ncep.noaa.gov/) is the biggest provider of seasonal forecasts, although there are a few others out there. This year we are in a La Niña, and so most of the seasonal forecasts have been based on that affecting our climate this winter. I won’t discuss La Niña here today (that is a topic for a future post, perhaps) but you can read a good general description at https://oceanservice.noaa.gov/facts/ninonina.html. The basic patterns of La Niña affect the temperature and precipitation across the United States in fairly predictable ways, and you can use statistics to show these patterns. You can see some examples of how La Niña has affected past winters at https://www.weather.gov/mhx/ensoninaanomalies. This year, the primary predictors of the winter climate have been the La Niña and the persistent trend that we are seeing towards warming temperatures due to greenhouse warming. From a statistical standpoint, it made great sense to predict that this winter would be warmer and drier than normal in the southern US and colder and wetter than normal in the north, because that is statistically the most likely pattern to expect in a La Niña winter, even when the climate is trending warmer over time.

So why did it not work this year? Because statistics can’t account for rare events that don’t follow the expected patterns. At the end of 2020 the atmosphere over the North Pole experienced a Sudden Stratospheric Warming (SSW), which means that the atmosphere about 10 miles above the North Pole suddenly got much warmer than usual. That messed up the usual distribution of temperatures in the Northern Hemisphere and helped push the really cold air to the south. It also pushed the winter storm track far south of where it usually occurs, making this a very wet winter in the Southeast, which is not what we expected! My farmers are not happy, but at least it means less likelihood of drought this summer. You can read more about the SSW at https://climate.gov/news-features/blogs/enso/sudden-stratospheric-warming-and-polar-vortex-early-2021. It might happen only once every ten years, or the cold air might just get pushed in a different direction next time, missing you and your winter garden altogether. Since the models are based on statistics, they will always show the most likely pattern, and instead we might experience winter that happens just once in ten years. Not so different that being the lucky person who gets rained on when the National Weather Service predicts just a 10 percent chance of precipitation!

90-day temperature departure from normal. Source: https://hprcc.unl.edu/maps.php?map=ACISClimateMaps

The good news is that we are getting better at these sub-seasonal to seasonal predictions, and we can expect to see improvements in the future as computers become more powerful and we have more experience looking at these periods. But for now, statistical models will continue to control the predictions at these intermediate periods, and we will continue to see the occasional miss when an unusual weather event occurs.

The weather where you are

Greetings from Athens, GA! I am happy to join the group of contributors to the Garden Professors blog. My name is Pam Knox, and I am an agricultural climatologist in Extension at the University of Georgia as well as the Director of the UGA Weather Network and a former State Climatologist from Wisconsin. While I don’t claim to be an expert in gardening, I do know a thing or two about how weather and climate affect plants and hope to share some of that expertise with you over time. You can learn a little more about me from my bio on the blog page.

Source: Merritt Melancon, University of Georgia College of Agricultural and Environmental Sciences

If you really like learning more about weather, climate, and agriculture, you are welcome to visit my own blog page, “On the CASE—Climate and Agriculture in the SouthEast” at https://site.extension.uga.edu/climate/, where I post almost daily about stories that have caught my eye as well as climate summaries and outlooks for the southeastern US. I plan to post on the Garden Professors blog here about once a month and am happy to answer questions at any time at pknox@uga.edu.

A simple way to compare temperatures around your yard

For my first post, I thought I would talk a little bit more about the weather in your yard and how you can learn more about it. As gardeners, you probably spend more time in your yards than I usually do, and so you have noticed that the climate of your yard or field can vary quite a bit from one spot to another. We call that “microclimate” and if you search this blog for that term, you will find several articles about microclimates in previous years, so I won’t spend a lot of time on that here.

Source: toby everard / Blaen y Cwm in a frost pocket / CC BY-SA 2.0

One easy and inexpensive way to measure how temperature varies across your domain is to use an infrared thermometer to spot-check the temperature at a variety of locations. These thermometers are used a lot now to check forehead temperatures in the age of COVID, but they are also used by HVAC technicians to check heating and air conditioning, for example. You can find inexpensive ones selling for less than $20 online, and many hardware stores have them, too. You will be amazed how much difference there is in temperature between sunny and shady locations! Don’t forget to try it at night too to see how much tree canopy can affect night-time temperatures. Of course, if you want a more systematic and scientific approach, you can follow Linda Chalker-Scott’s experience using multiple min-max thermometers as described in http://gardenprofessors.com/microclimate-follow-up/.

Infrared thermometer. Source: LuckyLouie, licensed under the Creative Commons Attribution-Share Alike 3.0 Unported.

CoCoRaHS: Precipitation measurements by citizen scientists

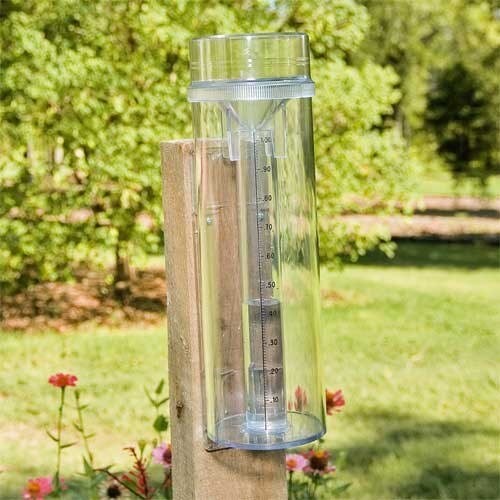
One of the many things I do is to serve as a regional coordinator for CoCoRaHS, short for Community Collaborative Rain, Hail, and Snow network. This is a group of dedicated citizen scientists who take daily rainfall measurements and report them online via computer or smartphone as part of a nationwide (and now international) network of precipitation observers. Theses observations are used by the National Weather Service, drought monitors, water supply managers, and others to document local variations in rainfall at a much denser scale than other available observing networks. I am sure that some of the readers of this blog are already contributing! You can learn more about the network and how to sign up at https://www.cocorahs.org/. Please keep in mind that they do require the use of a particular scientific rain gauge, so a hardware store gauge is not likely to have the degree of accuracy that is needed to participate. A list of inexpensive vendors (costs start around $40 plus shipping) can be found on their site in the right column. By measuring precipitation at your house, you are not only monitoring your own conditions but contributing to our knowledge of water availability around the US and beyond.

One version of the standard CoCoRaHS precipitation gauge. Source: Lamartin, licensed under the Creative Commons Attribution-Share Alike 3.0 Unported.

I am looking forward to interacting with you all in the months ahead, and please feel free to contact me if you have specific weather or climate questions.