The cooler weather that many parts of the eastern United States are experiencing this week is causing many gardeners to think about what this fall will be like. In fact, many farmers in Georgia are already planting fall crops, and I am sure that many gardeners are also busy with their own fall planting if they live in the Northern Hemisphere mid-latitudes. In this blog post we will discuss seasonal forecasts and how you can use them to plan and plant your garden.… Continue reading this article “Getting Ready for Fall: What do the long-range outlooks tell us?”
Author: Pam Knox
Pam Knox is the Director of the University of Georgia Weather Network and an agricultural climatologist who studies how weather and climate affect crops, livestock, forests, and water resources. She posts stories about current weather and climate issues as well as impacts of changing climate on her blog, "Climate and Agriculture in the Southeast."
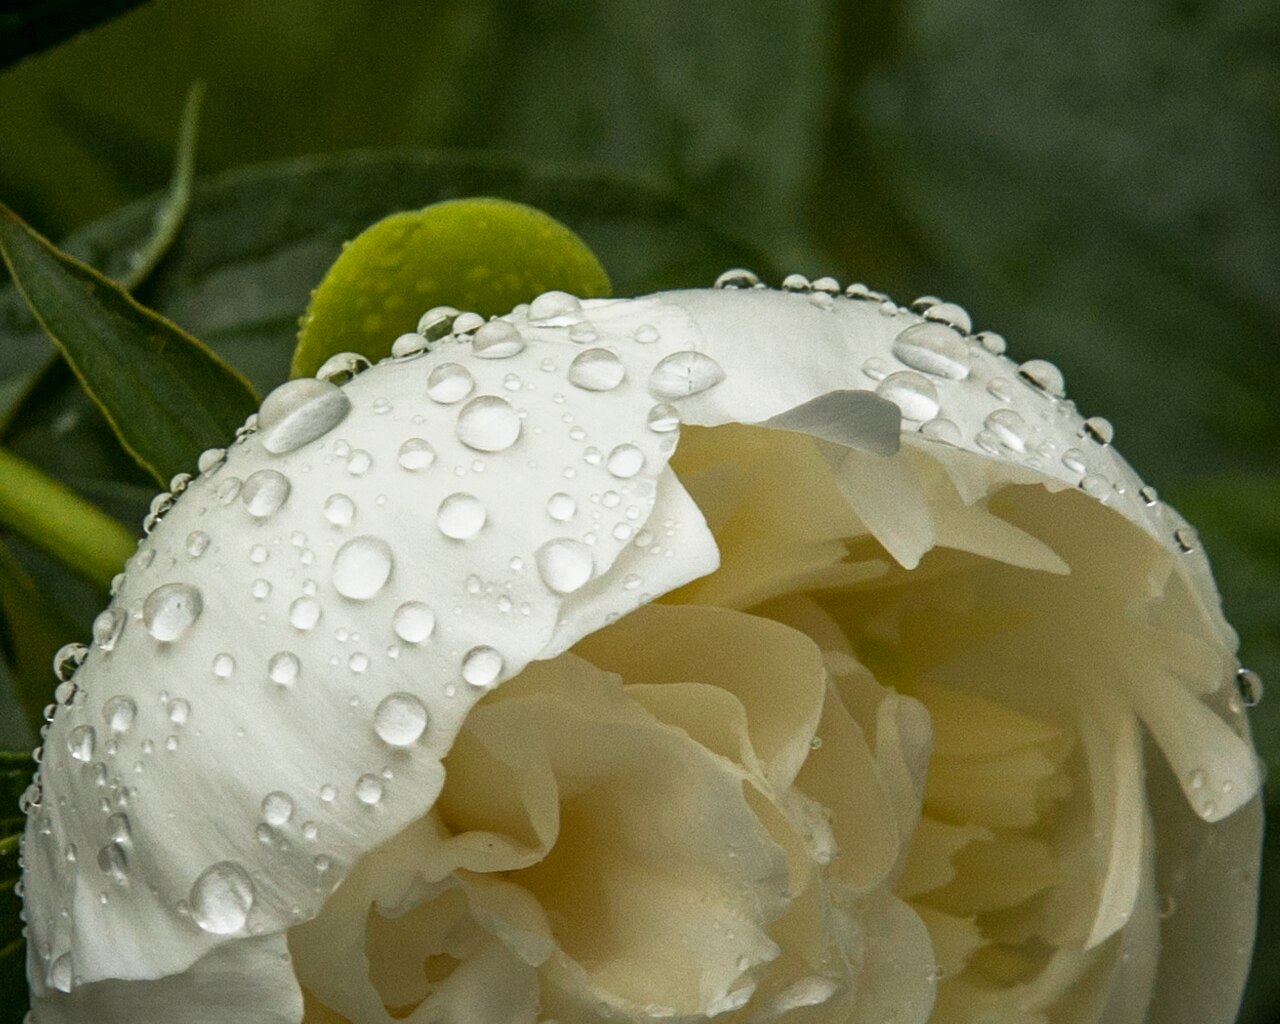
Using clouds to predict the weather
Have you ever stopped while you were gardening to look at the clouds? Clouds, like flowers, come in a variety of shapes and sizes that can form beautiful patterns in the sky. But clouds are not just pretty, they can also be used to make predictions about the weather in the coming days. In this week’s post, we will look at the different types of clouds and how they relate to coming weather. You can use that to prepare for your garden work by knowing when it will be sunny and predicting when rain is coming.… Continue reading this article “Using clouds to predict the weather”
Fire and Ice: Why the East is baking while the West is freezing
If you’ve been paying attention to the weather across the United States this past week, you may have noticed that most of the eastern U. S. is experiencing extremely hot temperatures, especially when you factor in the effects of humidity. At the same time, in the western U. S., it has been snowing in the mountains, even though it is almost July! In this week’s blog post we will look at why this pattern of hot and cold conditions occurs so often and what is causing it.… Continue reading this article “Fire and Ice: Why the East is baking while the West is freezing”
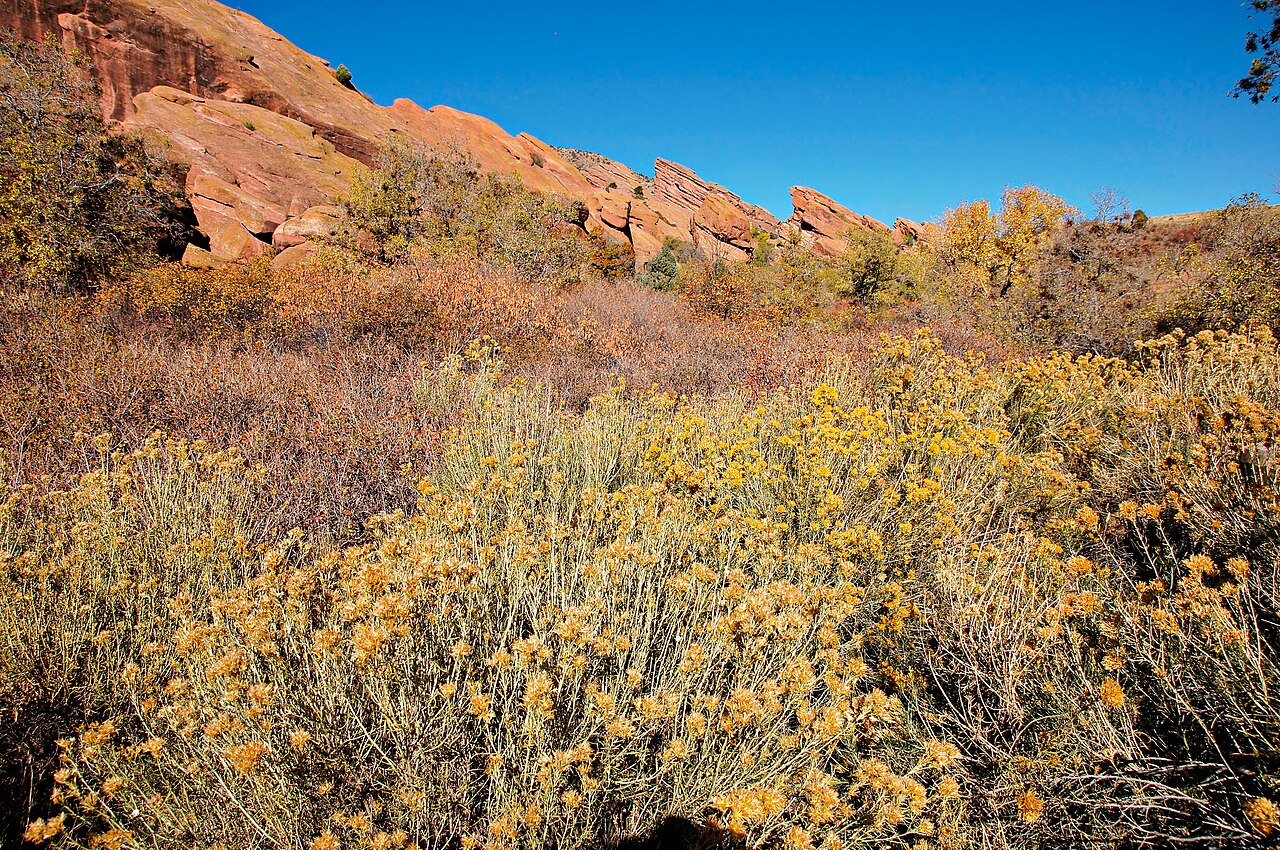
Gardening in high places
I am traveling in Colorado this week, so my thoughts naturally turned towards the mountains. Mountains affect gardening in a number of ways, many of which include a weather or climate component. They also provide some special challenges for gardeners because of the harsh conditions and short growing seasons that are often found in and near mountainous terrain.
How the mountains affect weather and climate
It is said that mountains create their own weather, and there is a lot of truth to that.… Continue reading this article “Gardening in high places”
The end of La Niña and what we expect in this summer 2025
In the last few weeks NOAA has declared the end of the weak La Niña that has been present in the eastern Pacific Ocean and the return to neutral conditions. I want to take time today to discuss what it means for our summer growing season in the United States. I will also provide some links to guidance for how it might affect conditions in other parts of the world for our non-US readers.
Why do we keep track of La Niña and El Niño?
… Continue reading this article “The end of La Niña and what we expect in this summer 2025”“Can’t start a fire without a spark”
There are many popular songs about fire. Those of you who are fans of Bruce Springsteen will recognize these lyrics from “Dancing in the Dark”. They popped into my head when I was driving home from Asheville NC to Athens GA this past weekend and noticed plumes of wildfires punctuating the air along the highway. That inspired me to write this post on wildfires, which are affecting the Southeast this spring but also affects many areas of the United States and the world too, especially when those areas are in drought.… Continue reading this article ““Can’t start a fire without a spark””
Digging into spring planting: The importance of soil temperature and moisture
It’s that time of year again (unless you live in the Southern Hemisphere). Gardeners everywhere north of the tropics are thinking about what to plant and when to plant it. Everyone has their own method for determining when to put seeds in the ground outdoors. Many of them are tied to particular calendar dates or to holidays like Easter or phases of the moon. A few are even tied to sayings handed down from grandparents.… Continue reading this article “Digging into spring planting: The importance of soil temperature and moisture”
Is snow really “poor man’s fertilizer?”
I’ve been thinking about snow and winter precipitation a lot this week as Georgia digs out from a record snowfall that hit the southern part of the state with amounts of up to 9 inches. This is the second snow event this winter, something that does not happen very often here, although I know it is much more common in many other parts of the country and the world. The heavy snow band stretched all the way from eastern Texas to eastern Virginia up the East Coast, bringing record snow amounts to many areas along the path, including a very heavy snowfall in New Orleans.… Continue reading this article “Is snow really “poor man’s fertilizer?””
2024 in Review and a look ahead to 2025
How did your garden grow in 2024? Was it a lush playground full of beautiful flowers and plentiful produce? Or was it a sere landscape of brown, wilted foliage? How your own garden fared in 2024 was certainly dependent on where you live, what you had planted, and how you took care of it, but it was also subject to the variations in weather and climate in your area. This week we will take a look back at the climate conditions in 2024 and look forward to what it might mean for 2025.… Continue reading this article “2024 in Review and a look ahead to 2025”
Underneath a blanket of snow
I am writing this post on Thanksgiving Day, and I can hear football in another part of the house while I sit here with cat in lap. Here in Georgia, we are still officially in the growing season, although that will end in the next few days since a cold front has pushed through today, ushering in much colder conditions that will result in temperatures in the mid-20s next week. It will be a while before we see snow, though, and in fact we only get it every couple of years in Georgia, so we may not get any snow at all this La Nina year, since La Nina winters are usually warmer and drier than usual in the Southeast.… Continue reading this article “Underneath a blanket of snow”