Getting Ready for Fall: What do the long-range outlooks tell us?

Facebook

The cooler weather that many parts of the eastern United States are experiencing this week is causing many gardeners to think about what this fall will be like. In fact, many farmers in Georgia are already planting fall crops, and I am sure that many gardeners are also busy with their own fall planting if they live in the Northern Hemisphere mid-latitudes. In this blog post we will discuss seasonal forecasts and how you can use them to plan and plant your garden.
Sumac turning orange in early fall, ShenandoahNPS, Commons Wikimedia.

What kinds of long-range forecasts are available?

In weather and climate, there are two basic types of forecasts. The first is a deterministic forecast, which gives an outlook that describes the specific weather that is expected to occur at a discrete time in the future. Deterministic forecasts are commonly used for weather forecasts for the next few days and are based on computer model predictions that are grounded in the physical equations of motion, thermodynamics and other properties of the atmosphere. Generally, deterministic forecasts are most useful within a few days after the forecast is made. As you go farther out in time, they become less accurate due to lack of updated weather observations and drifts in the models due to the chaotic nature of the atmosphere. In general, a deterministic forecast is not very accurate more than a week ahead of when it is made. They are better than they used to be, and the accuracy of a 7-day forecast now is as good as a 5-day forecast was a couple of decades ago, but we will likely never have a perfect deterministic forecast more than ten days out.

Longer-term forecasts are usually given as probabilistic forecasts. In other words, the forecast will give a likelihood of occurrence of general weather conditions such as wetter or drier and colder or warmer than normal. For meteorologists, “normal” is a 30-year average of temperature and precipitation at a location and is currently based on the 1991-2020 period (they are updated every ten years due to the amount of work it takes to produce a clean dataset). Most probabilistic forecasts are based on multiple model results that start from slightly different conditions and are built with different methods of creating rain and clouds, moving temperature and humidity around, and start with different surface conditions. The more the models agree, the higher the probability of occurrence of a particular type of weather.

How to interpret the NOAA monthly and season forecast maps

In the NOAA map for September 2025 above, for example, there is a dark brown area centered on the Great Salt Lake in the western United States. This is an area that has a strong probability of being drier than normal in the month of September based on the available model output. The fact that it is dark brown does not mean it will necessarily be much drier than normal, but that we have a strong likelihood that it will in the lowest third of years in terms of how many inches of precipitation it is likely to experience. These forecasts start from even odds of having near normal precipitation (34%), above normal precipitation (33%) and below normal precipitation (33%). If the climate forecast models indicate mostly dry conditions at a point, then the percentages shift to something more like 34% near normal, 50% below normal, and 16% above normal precipitation. Because there is so much uncertainty in the atmosphere, you never know with total accuracy which category the season will fall into, you just have some confidence of which way it is likely to fall. Since this is the average for an entire month or season, there can be periods within that time span that are significantly different weather that what the probabilities suggest are the most likely to occur. Here is a list of what the seasonal forecast maps do NOT tell us.
Early Fall Dogwood Leaves, Shenandoah National Park, Commons Wikimedia.

Deterministic versus probabilistic forecasts

If you are planning an outdoor event like a garden wedding months ahead, a deterministic forecast is what you would probably want to know. Do we need to rent a tent? Should we expect hot or cold weather when we purchase a dress? Unfortunately, this is not possible a long time ahead and so you need to use previous or average weather conditions on that date to decide what kind of weather is most likely to occur and be aware that you could be wrong. There are a few commercial forecasting sites that provide specific deterministic forecasts up to 90 days ahead. I asked a friend who works for one of these companies why they do it when research shows that there is no skill involved, and he told me they do it for “entertainment value.” In other words, it is not real information, it is just click-bait. The same thing happens with wild hurricane forecasts on social media that show a single deterministic forecast of a huge storm hitting somewhere like Tampa, conveniently not showing the 99 models with no such storm present. Don’t believe them, they are harvesting clicks, not providing useful information.
Early fall leaf against sandstone, cogdogblog, Commons Wikimedia.

The Farmers’ Almanac and the Old Farmer’s Almanac

Every year, including this one, publishers release almanacs each fall which claim to show what the weather will be like for 1 to 3-day periods for the winter and next year. Their winter outlook maps get a lot of press about what to expect weatherwise for the next few months (I won’t post any links in this post but you can search online if you are really curious). If you read them carefully, you can see they are quasi-deterministic since they reference storms or heat waves occurring at specific areas over just a few days, although they are usually written in broad enough language that they can be interpreted in several ways. Many people use these for planning their gardens, and they do contain useful information about climatological conditions, average frost dates, and sunrise and sunset information. But scientists have shown that they are only about 50% accurate, which amounts to pure chance. They base their forecasts on secret formulas that cannot be scientifically studied or verified so we have no way to know what they are really using to determine what those forecasts will be. So if you buy one this year, I challenge you to keep track of what they forecast and what weather actually occurred at your house and see if they did any better than chance in 2026. Let the buyer beware and use them for “entertainment value” only.
What can we expect this fall?

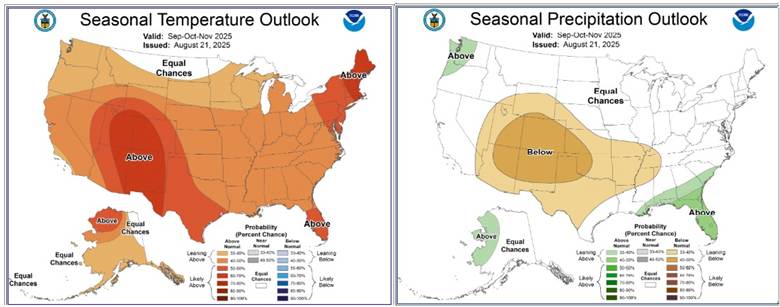
Based on NOAA’s probabilistic forecast, we can expect the temperature across most of the United States to be warmer than normal, with some areas more likely to be warm than others. This is likely due to the continuing greenhouse warming that is occurring, making every year (on average) warmer than the previous one, although there is a lot of variation within that trend from one year to the next. Precipitation in the Southeast for the September through November period is leaning towards wetter than normal conditions, and that is probably related mostly to the second half of the Atlantic hurricane season, which could bring heavy rain to parts of the Southeast during fall even though parts of it will certainly be missed. The southwestern United States centered on the Four Corners area is expected to be drier than normal in an area that is already quite dry climatologically.

For the December through February period, the forecast is showing a pattern of climate conditions that is consistent with the La Nina that is expected to occur as we head into winter, with warmer and drier conditions in the southern US and wetter and cooler conditions in the northern US. If you live in a different part of the world, you can find images of the expected La Nina conditions here. Choose plants according to the climate conditions you expect and be prepared to manage them for those conditions, so that if you are in the South, you may have to water more frequently because of the drier than average conditions.
Early fall colors in northern MN, 3 September 2017, U.S. Fish and Wildlife Service – Midwest Region, Commons Wikimedia.

Seasonal outlook maps can provide clues to the kind of temperature and rainfall conditions you are likely to experience in your neighborhood over 3-month periods, although they will not give you specific details about when the first frost might occur or how many heavy rain events you can expect to see. But knowledge of the likely pattern of conditions you can expect will allow you to plan what kind of plants to put in the ground and how you are likely to have to take care of them as they grow.

Just an additional note: If you like to track the fall colors, check out this interactive fall foliage map at https://www.explorefall.com/, now including Alaska. It’s a great resource for planning weekend trips to areas you think will be experiencing beautiful fall foliage.
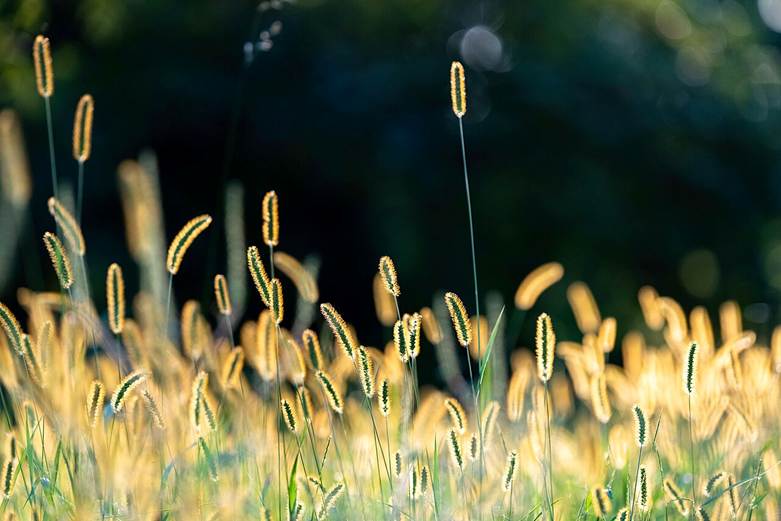
Backlit grass in the early fall at Shenandoah Valley Outlook, ShenandoahNPS, Commons Wikimedia.

Facebook

Using clouds to predict the weather

Facebook

Have you ever stopped while you were gardening to look at the clouds? Clouds, like flowers, come in a variety of shapes and sizes that can form beautiful patterns in the sky. But clouds are not just pretty, they can also be used to make predictions about the weather in the coming days. In this week’s post, we will look at the different types of clouds and how they relate to coming weather. You can use that to prepare for your garden work by knowing when it will be sunny and predicting when rain is coming.

Daisy sky, Dhilung Kirat, Commons Wikimedia.

How are clouds classified?

Clouds were first classified by Luke Howard in 1803 in his “Essay of the Modifications of Clouds”. Howard classified the clouds by their shape, using Latin names for wisps (cirrus), lumps (cumulus), or sheets (stratus) to describe how they looked in the sky. Clouds that are precipitating either rain or snow are called nimbus clouds. Some clouds are a combination of types, such as stratocumulus clouds, which look like a layer of lumpy clouds, or cumulonimbus clouds, which are the tall thunderstorms that form in summer. You can find a great gallery of cloud photos at the Cloud Appreciation Society. Wikipedia has an exhaustive list of cloud types online as well.

Clouds are also classified by heights. Most clouds form in a single layer of the atmosphere, but you can often see multiple layers of clouds when you look at the sky. These layers may be caused by different mechanisms. The shape and height of the clouds provide clues to what is going on in the atmosphere and are especially related to the presence (and sometimes absence) of warm and cold fronts that are harbingers of precipitation and a change in wind and temperature conditions.

There are many different types of clouds, each with a unique shape and location in the sky. UCAR/L.S. Gardiner

To estimate how high the clouds are, you can use a literal “rule of thumb” that works well for cumulus-type clouds. Hold your hand out towards a cloud. If the individual cloud is the size of your fist, then it is probably a low cloud. If the lump of cloud is the size of your thumb, then it is probably a mid-level cloud. And if it is the size of your little pinky joint, then it is probably a high cloud. Note that the clouds are the same size, but the difference in height makes them look like they are different sizes.

For stratus clouds, you can estimate the height by how transparent it is. A cloud layer that allows you to clearly see where the sun or moon is located is probably a high cloud. A layer that lets you see where the sun is but shows it with blurry edges (we sometimes call this a “ground glass” appearance), then it is probably a mid-level cloud. If it is so thick that you cannot see where the sun or moon is, then it is probably a low-level cloud. But please be careful not to look directly at the sun, since it can damage your eyes!

How do clouds form?

Clouds form where moist air cools off to the point that the water vapor condenses into small drops that become visible to us. Since the atmosphere generally cools off as you go up, the clouds form where the air is rising. The rising motion can be provided by heating from the earth’s surface, lifting of the air by a mountain, or large-scale upward motion caused by warm and cold fronts, where masses of air at different temperatures interact to create areas of rising air. The highest clouds usually form in the coldest air and form as ice crystals, leading to their wispy appearance. Lower clouds appear in warmer air where the water condenses as liquid droplets, leading to their more robust appearance.

Clouds associated with cold and warm fronts, U. K. Met Office.

How are cloud shapes related to atmospheric winds and structure?

The most interesting weather (at least to me, as a meteorologist) is where there are differences between masses of air at the surface and above the surface that are interacting. Boundaries between these air masses are called “fronts” and are named because they act like battle fronts between enemy armies. In a cold front (left side of diagram above), cold dense air near the surface pushes beneath a layer of warm, humid air, causing it to rise and cool. Clouds ahead of cold fronts tend to be relatively tall and energetic and form cumulonimbus clouds that can drop a lot of rain in a short time but generally tend to move through an area quickly unless the front stalls due to other atmospheric dynamics.

Warm fronts are large masses of warm, humid air that are pushing over the top of a layer of colder, more dense air (right side of diagram above). As the warm air rises, it slowly forms clouds as the layer cools to the temperature of condensation. Since the entire layer is rising, the clouds that form are often sheets of clouds rather than individual clouds. The higher clouds indicate that the moisture from an approaching warm front is present high in the atmosphere and shows that a warm front is likely to be approaching, signaling a change in the weather from cool to warmer conditions that could also drop rain as the warm front gets closer to your location. As the warm front gets closer, you should see the high clouds replaced by mid-level clouds like altostratus and then lower clouds like stratus clouds and nimbus clouds if they start producing rain. This usually happens over a day or two depending on the speed and strength of the surface warm front.

Pink flower, கவிக்குமார் ப, Commons Wikimedia.

If you see lumpy cloud forms, then they are most likely related to the rising motion of air due to columns of warm air rising from the surface (“thermals”). Air between the columns is sinking, which leaves clear spots between the clouds. Fair-weather cumulus clouds are the tops of these thermals, when the rising air cools down enough for the water vapor in the column to condense, forming the cloud. These types of clouds usually form when the ground is heated, most often by sunlight during the day but sometimes by pavement or wildfire as well as mountainous areas. They usually form on days when you are in a mass of warm, humid air that is far from a frontal boundary, although if they grow taller, then a cold front is likely to be approaching.

If the air is very hot and humid and the surrounding air is cooler than the rising column, then the clouds can grow vertically to great heights before they hit a layer that is warmer than the rising air and stop growing. These tall clouds are called cumulonimbus clouds because they often drop heavy rain as they develop. These often form along and ahead of cold fronts and indicate that the wind is likely to shift from a south wind to a colder wind coming from the northwest (in the Northern Hemisphere). In the worst cases, the rain can cause erosion or damage to fragile plants when it is very intense. Plants that live in rainy areas evolve to have such things as pointed tips or shiny leaf surfaces that shed the water quickly. Cumulonimbus clouds are also sometimes associated with high winds, hail, and tornadoes, all of which can damage garden plants and trees as well as harm humans and animals.

Cirrostratus clouds being illuminated by the sun and forming a halo, Eduardo Marquetti, Commons Wikimedia.

How can you predict the weather by watching the clouds?

As you work in your garden, take a look at the clouds above you. If they are high and wispy, then moisture high in the atmosphere may indicate that a warm front and a chance of rain is likely in a couple of days, especially if they get lower and denser over time. The picture of daisies at the beginning of this post shows high, wispy clouds that could indicate a warm front is approaching. The glowing ring of light that appears in cirrostratus clouds in the picture just above this paragraph may also be a sign that there is moisture on the way, leading to the saying that “a ring around the moon means rain in 48 hours”.

The chance of rain may affect your plans to spray your gardens or lawns for pests or fungal diseases, since many garden treatments have weather-related requirements for when to use them. Some work better when applied to wet leaves after rain falls, but others need a period of dry weather for the chemicals to be most effective. Make sure you read the labels to know what kind of weather they need. It may also tell you that it would be a good idea to mow the grass before it rains in the next 24-48 hours.

An Intercity from Amsterdam to Den Helder passes a field in full bloom near Schagen, Netherlands, Kabelleger / David Gubler, Commons Wikimedia.

If you are already in hot and humid conditions and you see cumulus clouds getting taller and more numerous over time, a cold front may be approaching. This could indicate a period of strong winds, heavy rain, some possible lightning, and sharply cooler temperatures which could be either a curse or a blessing depending on just how hot it has been. The very shallow clouds in the picture above (cumulus humilis) are most likely seen after the cold front has passed and there is minimal lifting to cause clouds to form.

Don’t forget to look up

A good gardener should always be keeping an eye on their garden but should also be watching the environment around it to see how the conditions might be changing in the future. Who knows what delights you will see if you just look around you? But don’t forget to look up, too, because the sky is full of wonders and can inform you about the future as well as strike you with awe.

Christian Collins, https://www.flickr.com/photos/collins_family/37126898590/, Commons Wikimedia.

Facebook

Fire and Ice: Why the East is baking while the West is freezing

Facebook

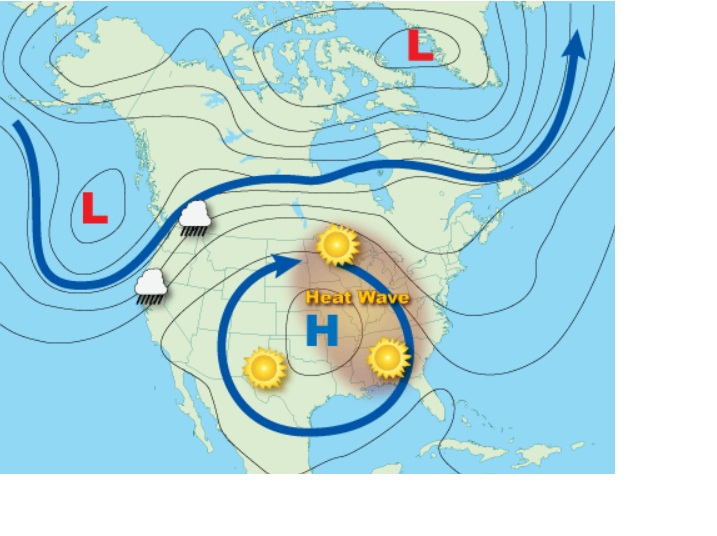
If you’ve been paying attention to the weather across the United States this past week, you may have noticed that most of the eastern U. S. is experiencing extremely hot temperatures, especially when you factor in the effects of humidity. At the same time, in the western U. S., it has been snowing in the mountains, even though it is almost July! In this week’s blog post we will look at why this pattern of hot and cold conditions occurs so often and what is causing it.

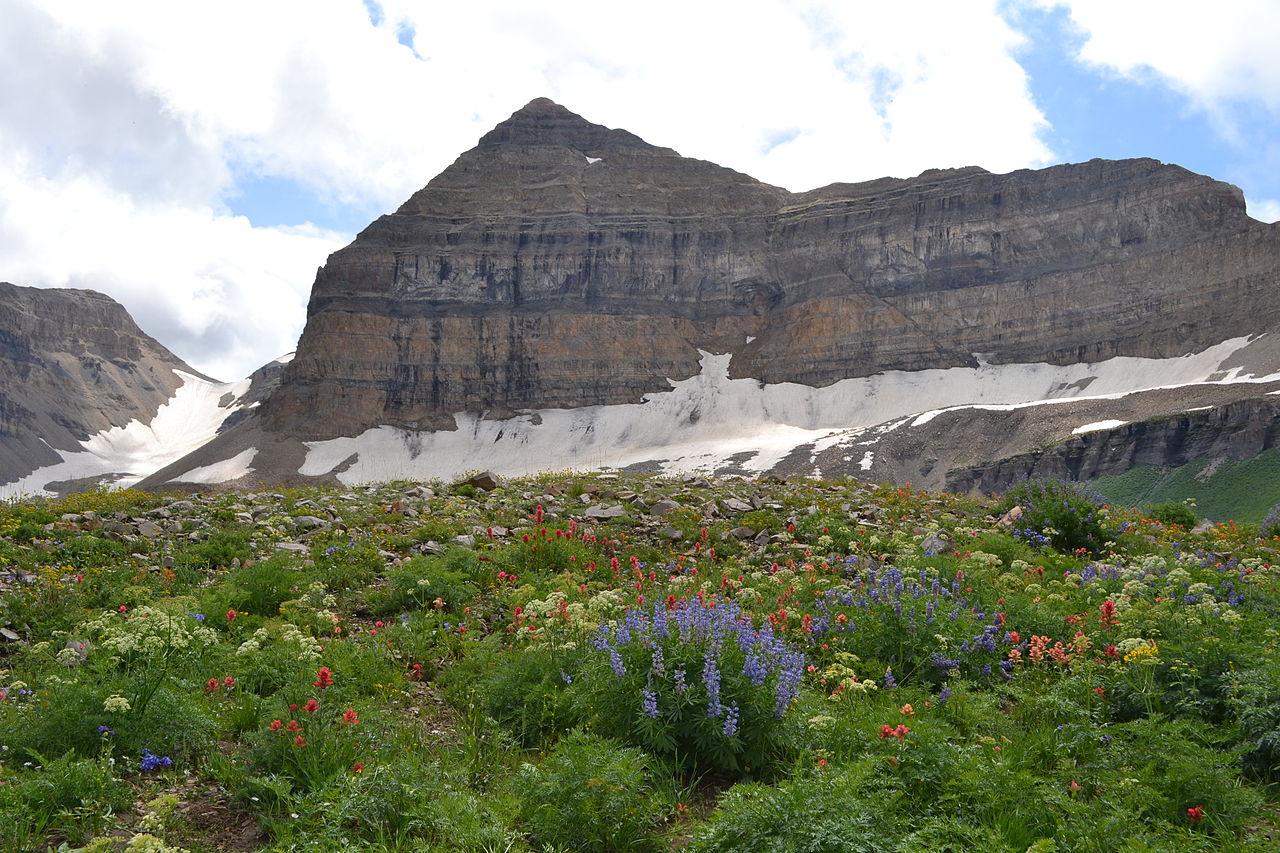
Mount Timpanogos with wild flowers (Utah, USA), Taken on 28 August 2011, Brian Smith, Commons Wikimedia.

Heat in the East

We have talked about persistent areas of very high temperatures several times in past blog posts (for example, here and here). Those areas most commonly form in summer under stagnant areas of high pressure that have sinking motion in the middle of the high. The sinking motion of the air keeps clouds and rain from developing, leading to very hot and dry air being trapped near the earth’s surface, raising temperatures and reducing wind speeds. Often those areas also include a lot of humidity, which makes the temperatures more oppressive because sweating does not cool you off efficiently if the humidity is high, especially if winds are also light.

Formation of a heat wave : a high-pressure circulation in the atmosphere acts like a dome or cap, trapping heat at the surface, National Ocean Service, NOAA.

When this happens, the National Weather Service will put out heat advisories or other statements reminding people to be careful to keep cool and stay out of the hot sun as a way to prevent heat-related illnesses like heat stroke. This is also important for gardeners, who like to spend time outside tending their plants and gardens. You can monitor the atmospheric conditions associated with heat to identify times when it would be better to stay inside where it is cool by using the National Weather Service’s HeatRisk map or the Southeast Regional Climate Center’s Wet Bulb Globe Temperature forecast tool (which is for the entire country, not just the Southeast).

Rafael Fire on June 27, 2021, InciWeb, Commons Wikimedia.

Note that heat domes don’t always occur in eastern parts of the country. A deadly heat dome occurred in the Pacific Northwest (PNW) in late June 2021, breaking numerous high temperature records and killing 136 people in Washington alone in the period from June 26 through July 6, 2021. In that case it was the West that was under unusually high temperatures while the Eastern U. S. was cooler than usual. They also occur in other parts of the world, and in fact this week Europe is also experiencing very high temperatures due to another region of high pressure parked over them.

It is also interesting to note that in winter, areas of high pressure are often the coldest areas of the country due to the lack of cloud cover, which allows heat from the earth to escape to space, leaving colder conditions at the surface at night when no sun is there to heat the ground.

Texel – De Hors – One of the heat wave days of the Summer of 2008 – At the South Beach Corner of Marsdiep & North Sea, Txllxt TxllxT, Commons Wikimedia.

Cold and snow in the West

On the other end of the country, cold air was trapped on the other side of the frontal boundary between the eastern high-pressure center and the low-pressure trough that was present in the western U. S. The cold air was so intense, especially at higher elevations, that snow fell in some mountainous areas of western Montana and surrounding states. The Going-to-the-Sun Road in Glacier National Park had to be closed from June 20 to June 23 due to the heavy snow.

What connects these two extremes together?

The common connection between the heat in the East and the snow in the West is the large-scale atmospheric wave that is linked to both the low pressure in the west and the high pressure in the East. The atmosphere is a fluid and is constantly adjusting its pressure fields by forming waves with ridges of high pressure as well as troughs of low pressure. Sometimes these patterns get locked in place for a few days (or even longer in rare cases), which leads to more extreme effects, but they usually move on in a few days, causing the weather to go back to normal conditions or even flip-flopping to the opposite pattern. In fact, we discussed atmospheric waves back in July 2021 following the PNW extreme heat event in this blog.

Blocking high pressure, NOAA, https://www.noaa.gov/jetstream/upper-air-charts/basic-wave-patterns.

The surface weather associated with these areas of high and low pressure are what cause the big changes in observed conditions that gardeners and farmers have to deal with since they can have big impacts on flowers and crops. The atmospheric wave pattern can lock in place for a number of reasons including conditions in other parts of the earth such as unusually cold or warm water in the ocean or droughts or floods in other areas. Fortunately, these stationary patterns usually shift or break down after a few days, leading to big changes in local weather conditions that might be more welcome.

How do cold and hot outbreaks affect gardens?

Most garden plants are fairly resilient to the changes in temperature, humidity, winds, and cloudiness that come with the shifts in the atmospheric waves and their associated surface weather. Plants respond differently to heat than humans and other animals do because they don’t sweat. High heat can cause the plants to close the stoma in their leaves to retain moisture, but a long enough period of high temperatures and dry conditions with little soil moisture leads to wilting and eventually, death of the plants. Of course, most gardeners are watering their gardens to avoid this worst case!

Red flower, Daniel Shawyer, Commons Wikimedia.

Cold spells in summer do not cause as much damage as frost and snow in spring and fall because they just don’t get cold enough to damage the plants (unless you are in the mountains and the temperatures drop below freezing), but they can slow the plants’ growth and reduce their flower or fruit production. Food crops that depend on a significant number of growing degree days (a measure of the accumulation of heat over time based on daily temperatures) will grow more slowly, resulting in late harvest of whatever crop is being grown. In the worst cases, it could delay harvest so late in fall that fall frosts become a consideration, but most home gardeners do not need to worry about this as much as commercial farmers because they are not farming hundreds of acres of crops, just their own patch of land.

I encourage you to visit some of the links in the article above to learn more about heat domes and atmospheric waves as well as their impact on your garden plants. You can also use the search field to find additional sources of information about any topic of gardening that you might want to learn more about, especially one that relates to the science of gardening. It’s a great resource!

残雪とエゾツガザクラ(Snow and flowers), pakku, taken on 31 July 2009, Commons Wikimedia.

Facebook

Gardening in high places

Facebook

I am traveling in Colorado this week, so my thoughts naturally turned towards the mountains. Mountains affect gardening in a number of ways, many of which include a weather or climate component. They also provide some special challenges for gardeners because of the harsh conditions and short growing seasons that are often found in and near mountainous terrain.

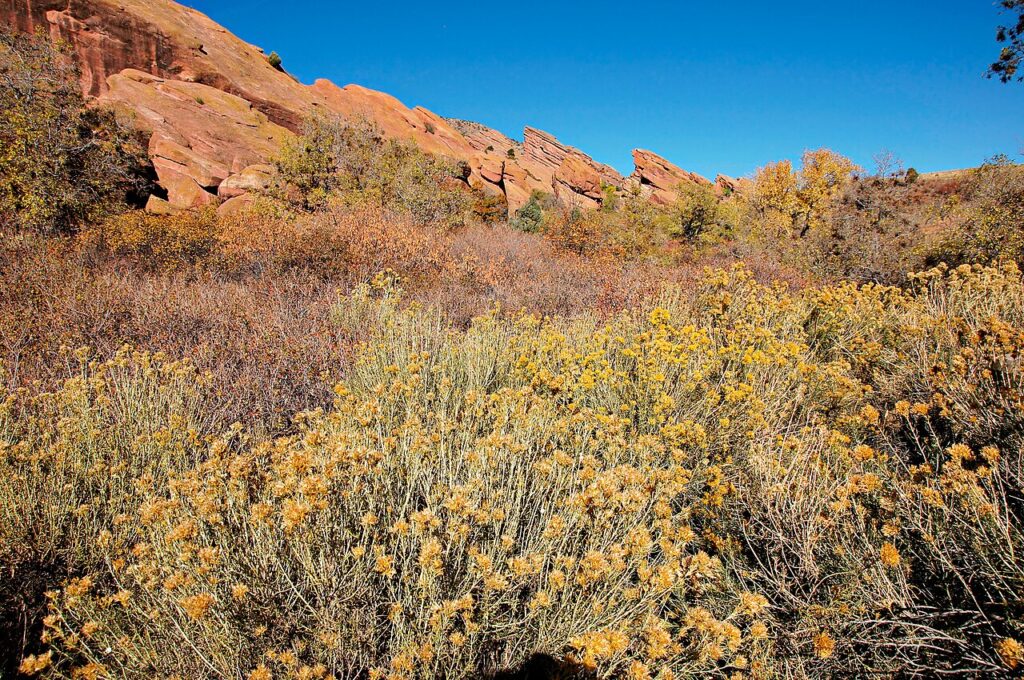
Red Rocks Park in Autumn, MichaelKirsh, Commons Wikimedia.

How the mountains affect weather and climate

It is said that mountains create their own weather, and there is a lot of truth to that. Mountains interact with the atmosphere in several ways, and that interaction can change both the atmosphere itself and the conditions on the surface of the mountain that is being affected by the air.

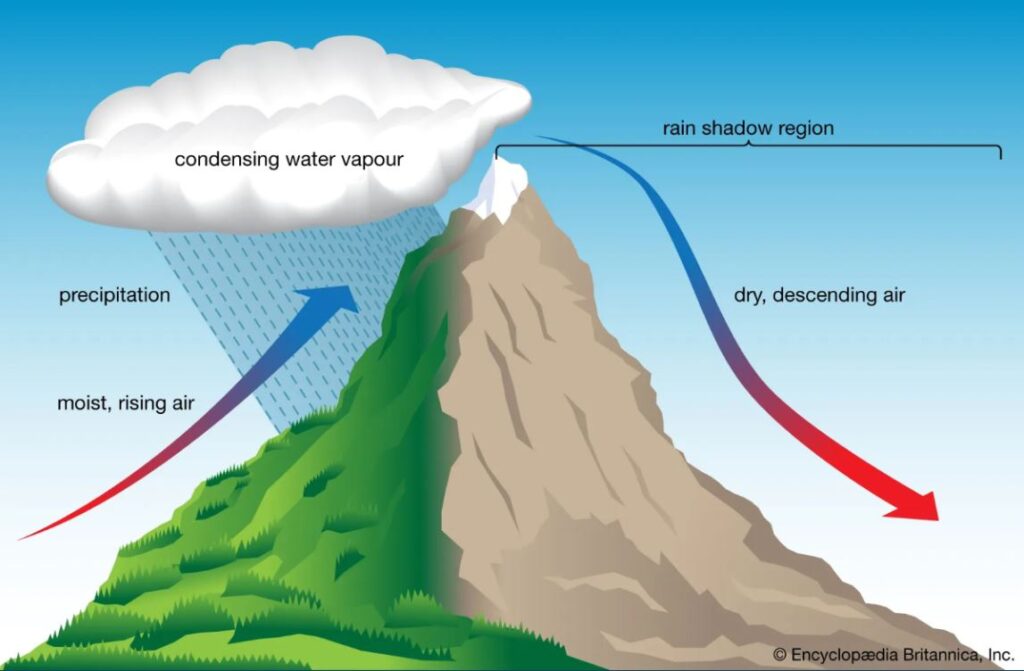
One way that mountains affect the atmosphere is by providing a physical barrier to the flow of air. Obviously, air can’t flow into a mountain slope, so it must either go up the slope, around the mountain crest, or through the valley between peaks. Air that is pushed up the mountain usually results in the formation of clouds on the upwind side, since rising air cools as it goes up and eventually the moisture in the air condenses to form cloud droplets, and eventually rain or snow, called “orographic precipitation”.

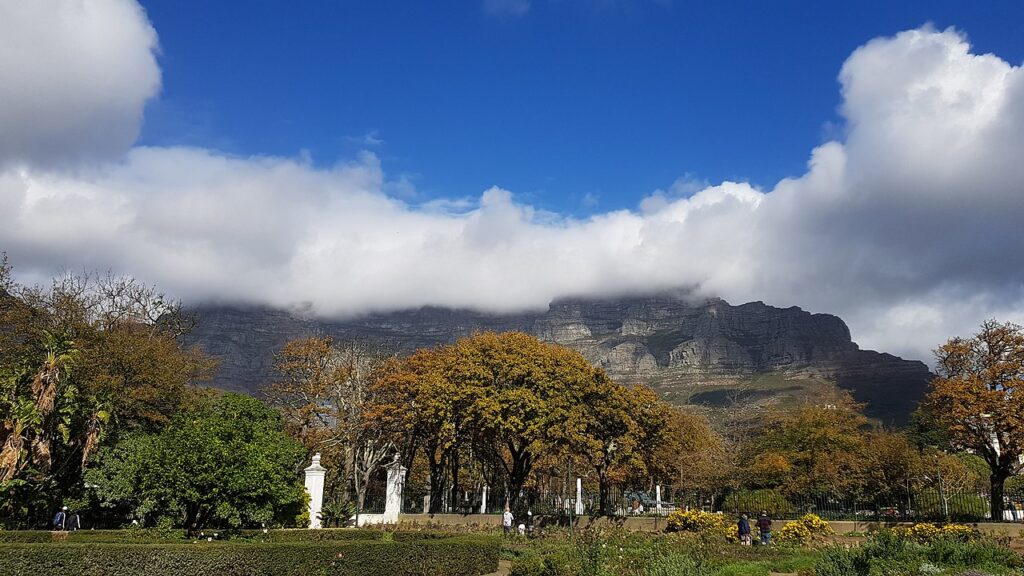
Cape Town—Table Mountain as seen from Company’s Garden, Romaine, Commons Wikimedia.

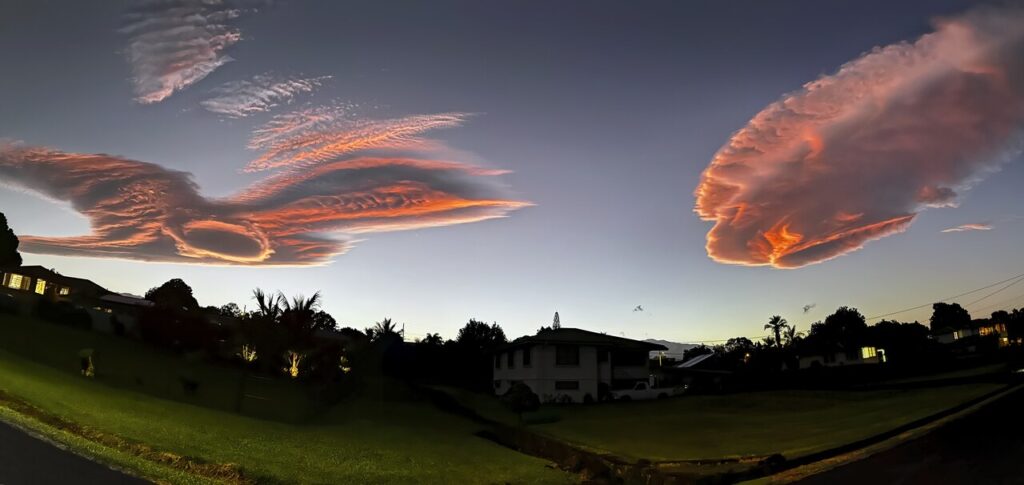
On the downwind side of the mountain, the air typically sinks and dries out, since the moisture has been wrung from the air by the rain or snow left on the upwind side. That can lead to a “rain shadow” effect with low precipitation amounts downwind of a single mountain or a range of mountains such as the Rockies. Flow over the mountains can also result in the development of lenticular clouds downwind as the air rises and sinks in waves produced as the wind moves over the peaks. You can see how rainfall affects climate across the United States at NOAA’s “The highs and lows of climate“.

Lenticular clouds captured at dusk in Hilo, Hawai‘i., Lenticular Clouds in Hilo, Commons Wikimedia.

If the air is diverted sideways around the mountain it can block the wind from hitting some locations downwind of the peak. Our fearless leader Linda told me she experienced this just a few weeks ago when a strong low-pressure center moved into the Northwest, bringing strong winds to the region. However, Linda noted that in her location, those winds were blocked by Mount Rainier, resulting in much lower local wind speeds due to the shelter from the massive mountain.

Wind flow up and down the mountains due to temperature variations

Mountains can heat or cool the air around them, depending on the time of day and the season. In summer, the peaks warm up and provide a heat source that helps lead to the formation of thunderstorms. You can see this almost every summer day in the western US with storms that develop over the mountains as the sun warms them. Those storms then move out over the prairies, leading to scattered rain or even virga, rain that evaporates before it falls to the ground. At night or in winter, the air near the peaks cools quickly and the denser air flows down the mountains into the valleys, resulting in katabatic winds that can cause freezes in low-lying areas when the coldest air reaches the lowest elevations. In this situation, the valley floors may experience frosts while areas on the slopes remain above freezing because the dense air drains through them relatively quickly. The winds can also increase evaporation rates, limiting the amount of available moisture and causing water stress on garden plants.

Orographic rainfall diagram, Encyclopedia Brittanica, Inc.

Temperature variation with elevation and orientation

The surrounding atmosphere also affects conditions on the mountain terrain. Atmospheric temperatures decrease with height, so as you go up in elevation on a mountain, the temperature will drop. This can lead to cooler climates and shorter growing seasons due to the increased likelihood of frost with the colder temperatures. This limits the types of plants that gardeners can grow because the climate of that location has limited suitability for plants that grow well on the flatlands.

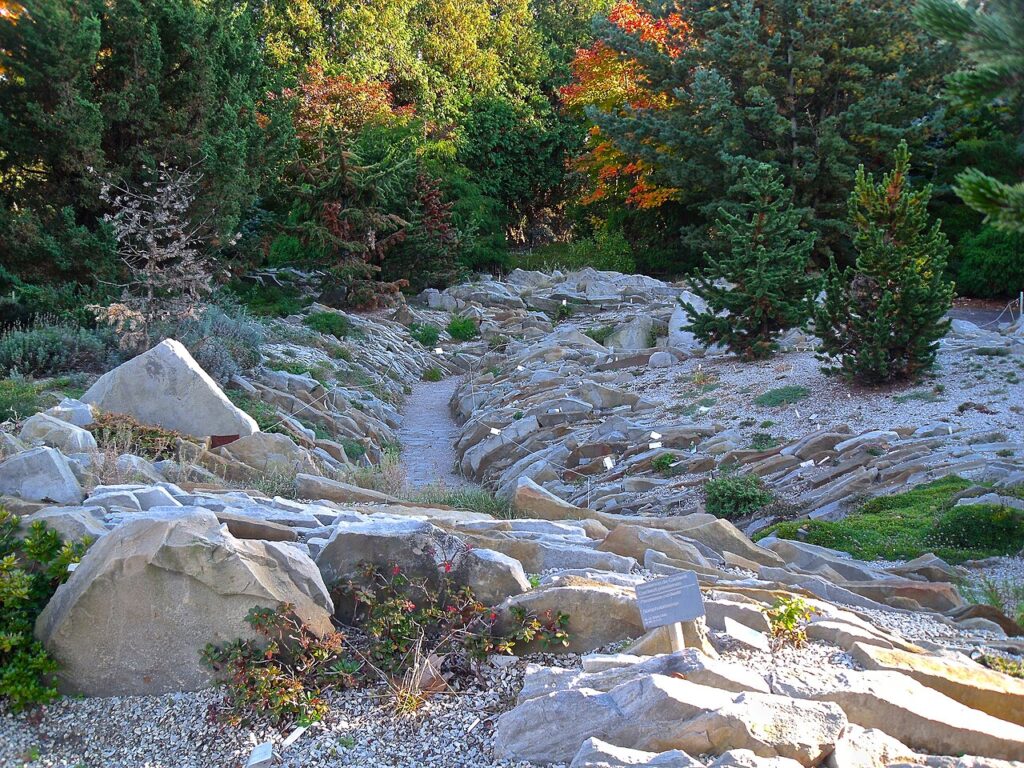
Another aspect of mountainous terrain is the number of microclimates that are present in the rocky, uneven landscape. Mountaintops and sides offer a range of microclimates, from sunny, well-drained slopes to shady, cooler areas, influencing plant growth in different locations. North-facing slopes get little direct sunlight and can pool pockets of cold air that result in frosts every month of the year, while sunny south-facing slopes could be much warmer and more suitable for a variety of plants. Any mountain gardener has to be especially aware of the local microclimates in their area and account for them when choosing what and when to plant.

Alpine garden, Montreal Botanical Garden, Thomas1313, Commons Wikimedia.

Of course, there are other characteristics of mountains that can also affect garden success. Soils are often shallow, rocky, and low in organic matter. Lower pressure and humidity may cause problems with plants’ ability to thrive in the harsher conditions. Sunlight can be very intense and shade from taller plants may be limited. Some areas may experience extensive periods of snow, which can provide insulation but can also damage plants when it slides downslope.

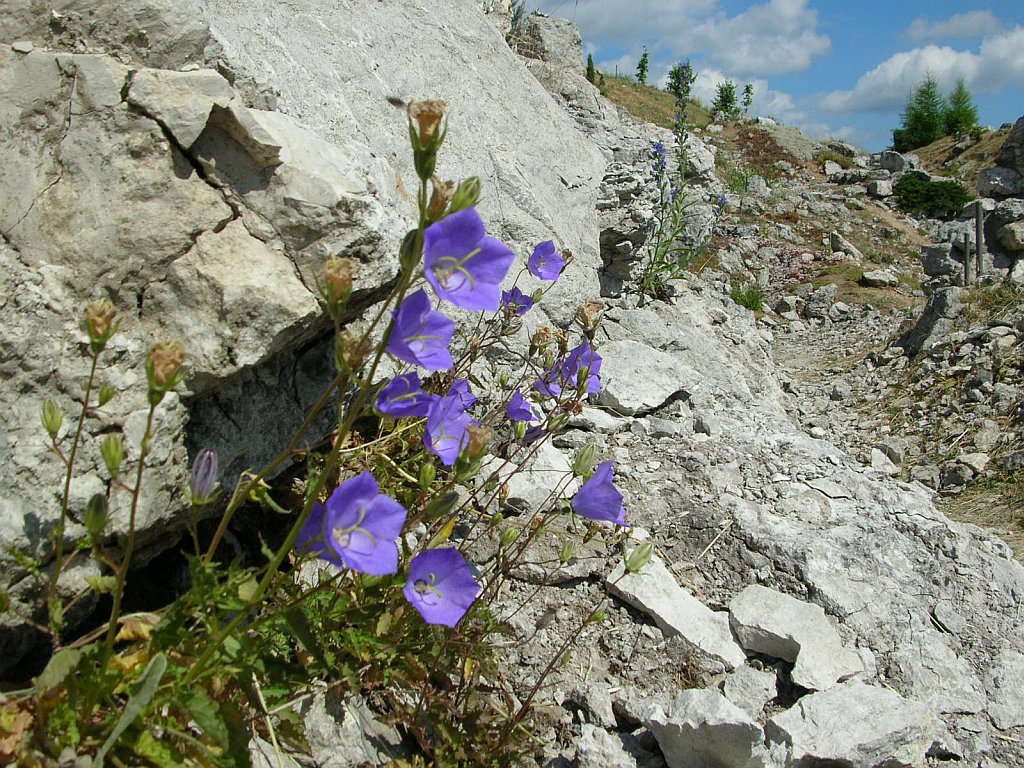
Gardening in the mountains can provide challenges for many gardeners due to the difficult environment that the mountain air provides, but it can also allow gardeners to create unique collections of alpine vegetation that can provide enjoyment for years to come, all set in a diverse and scenic landscape. Be sure to look for additional information on alpine or mountain gardening on the web to make sure your garden is well-suited to your local conditions.

Alpinarium w Bydgoszczy, Pit1233, Commons Wikimedia

Facebook

The end of La Niña and what we expect in this summer 2025

Facebook

In the last few weeks NOAA has declared the end of the weak La Niña that has been present in the eastern Pacific Ocean and the return to neutral conditions. I want to take time today to discuss what it means for our summer growing season in the United States. I will also provide some links to guidance for how it might affect conditions in other parts of the world for our non-US readers.

Rain droplets on peony, Paul VanDerWerf, Commons Wikimedia

Why do we keep track of La Niña and El Niño?

We have discussed El Niño and La Niña (collectively called El Niño Southern Oscillation or ENSO) many times in this blog. You can read more details here, here and here, for example. Over the past winter, the Eastern Pacific Ocean has been colder than normal; this is considered a La Niña event. We were waiting for it all fall but it was not officially declared until early January, and it was considered a weak event with cold conditions that barely met the criteria to be called a La Niña. A couple of weeks ago NOAA noted that the ocean temperatures no longer met the threshold to be called a La Niña and declared that we are back to neutral conditions with ocean temperatures returning to near-normal conditions. Where it goes from here is still uncertain, but the prediction is that we will be in neutral conditions for most of the summer and perhaps all the way through the rest of 2025.

We track ENSO carefully because it is an internal oscillation of the atmosphere-ocean circulation that has big implications for variations in climate across the globe.  If we know what phase of ENSO we are in, we can make some statistical predictions of what the climate is likely to be at our locations as well as others around the world. This is because the ocean temperature is linked to vertical cloud growth, which can act like a rock in a river, diverting the high-elevation winds north or south. Those winds push around the storms that bring clouds and precipitation to the regions where they are located, so that gives us some knowledge of what weather we might generally expect to experience. Of course, each El Niño and La Niña are different because the atmosphere is constantly adjusting in relation to other factors like droughts and floods, heat spells and cold outbreaks, so every event is unique, but statistically there are known relationships that give us some confidence in how our coming climate for at least the next few months might be.

Fountain Garden–Hampton Court Palace, Stevekeiretsu, Commons Wikimedia

What do we expect this Northern Hemisphere summer?

The strongest statistical relationships between the ENSO phase and climate conditions occur in the winter months, so the climate pattern this summer will be affected in some ways by the neutral conditions but will be more affected by other factors. The biggest impact will come during the Atlantic tropical season, since neutral years are linked to higher than average numbers of named storms. And sure enough, this year the early seasonal forecasts are for more storms than usual. The number is likely to be a little lower than last year because the Gulf and the Atlantic Ocean are not as warm as they were last year, although they are still warmer than average. Tropical cyclones in the Eastern Pacific Ocean could be fewer than normal because that is typical in a neutral year, but the water there is pretty warm so that would likely lead to more storms.

NOAA’s seasonal forecasts

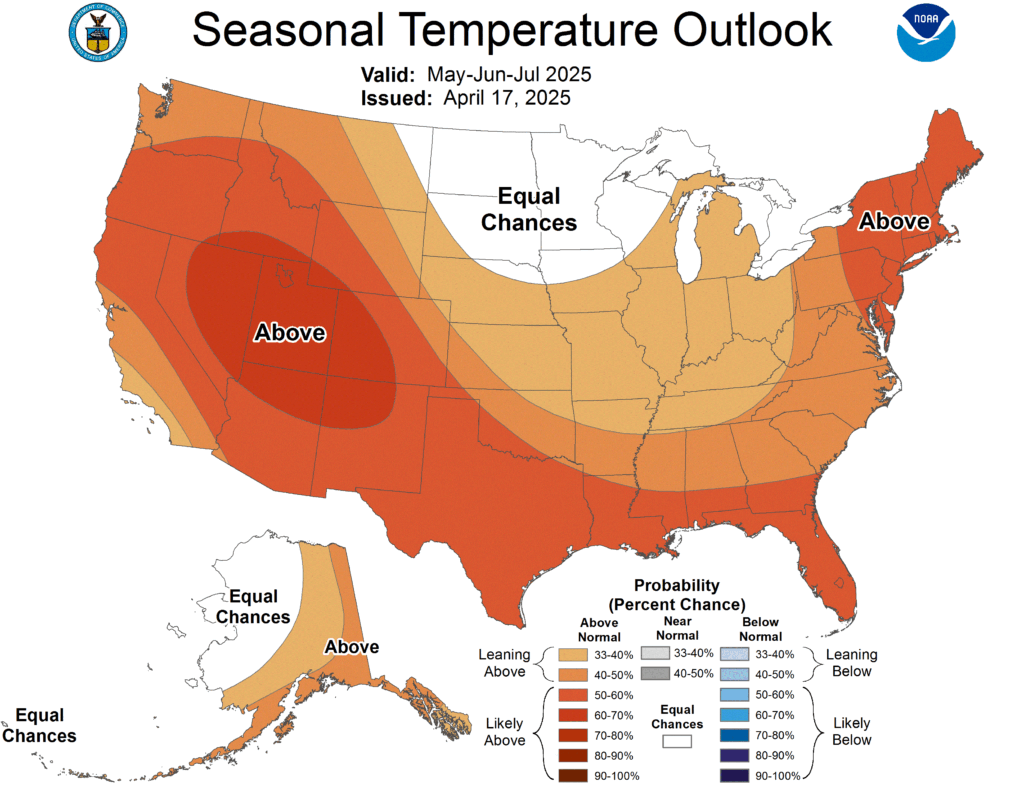
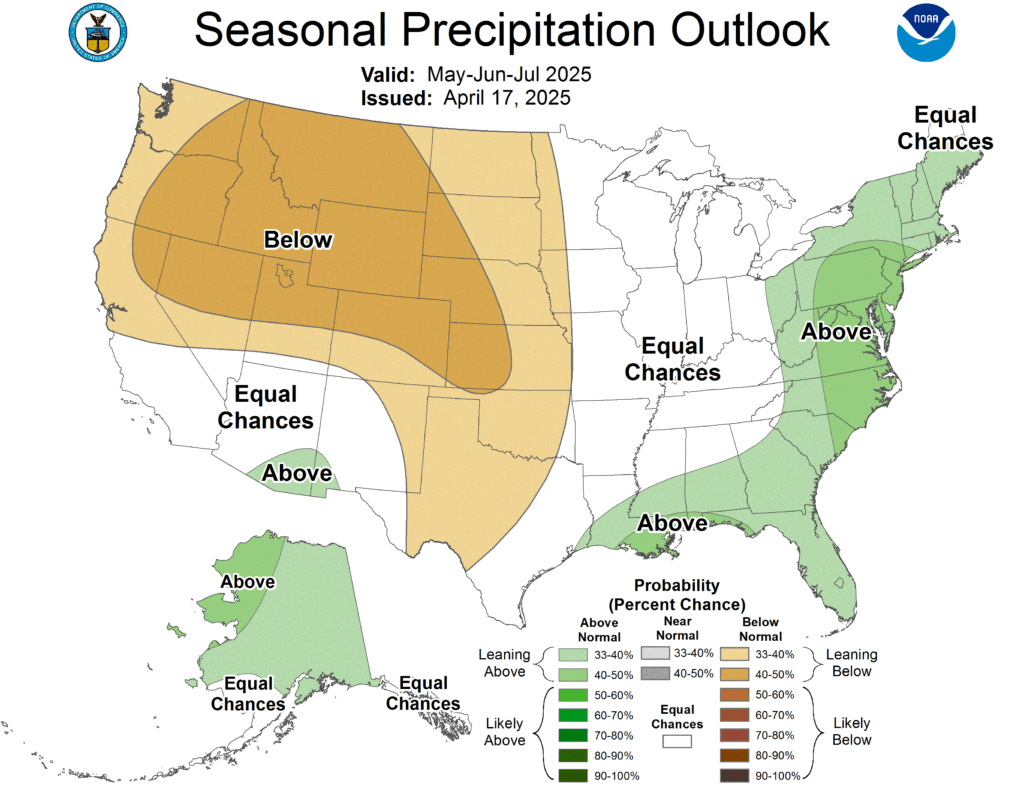
NOAA’s Climate Prediction Center has issued their 3-month forecasts for the early summer (May-July) and late summer (August-October). The maps are shown below. For the early summer period of May through July, most of the country is likely to be warmer than normal with the exception of the Northern Plains, which has equal chances of above, below, and near normal temperatures. Note that the depth of the color shows how high the probability of that condition is, not how hot it will be. The rainfall this summer is expected to be drier than normal in the western half of the United States except for southern Arizona and New Mexico, which has a chance of experiencing a wetter than normal monsoon. The northern Gulf Coast and the Eastern seaboard is all expected to be wetter than normal, at least in part because some of that rain will be coming from the tropical storms that are expected to occur during the hurricane season from June through November.

For later summer (August through October), all of the country is expected to be warmer than normal, with some areas more likely than others. Rainfall continues to show a wetter pattern than usual in the Southeast and in the monsoon region but is likely to be drier than normal in the northern Plains.

You might ask why the maps show a tendency towards above normal temperatures. That is mainly due to the rising temperatures associated with global warming. As temperatures continue to rise due to the greenhouse gases being emitted into the atmosphere, on the average each year will be a little warmer than the last, although of course there are year to year variations due to ENSO and other variations like ocean temperatures and drought that affect individual years’ statistics. But in the absence of detailed information about the coming year, it is a better bet that we will get a warmer than average year than a colder than average one.

How can gardeners use that information to plan this year’s gardens?

If you are just starting to plan or plant this year’s garden, you can use the information from the CPC to help determine what kinds of flowers and vegetables to put in. If you know that the summer is likely to be warmer than usual, then you can purchase plants that love the summer heat! Be prepared to water them, though, unless you are planting succulents or cacti. This will be especially true if you are also predicted to be drier than normal over the summer, because your gardens are likely to demand a lot of water if there is no rain to quench their thirst. You can help keep moisture in the soil by adding arborist chips as mulch over the surface of the soil to minimize the loss of soil moisture from the root zone.

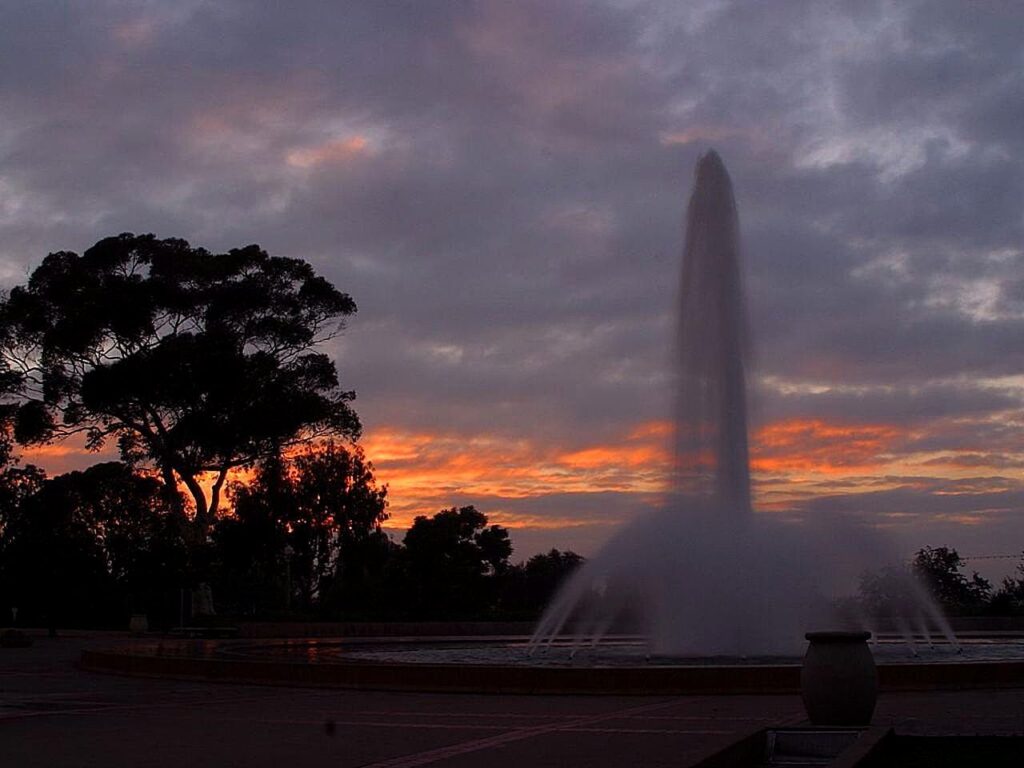
Fountains at Balboa Park, San Diego, Jon Sullivan, Commons Wikimedia.

Since neutral conditions, where neither El Niño nor La Niña are present, are associated with more tropical storm activity in the Atlantic, if you are living in an area that is normally affected by those storms, you should prepare ahead of time by storm-proofing your garden and home and watching the forecasts carefully once we start to get into the active season. It is never too early to prepare!

If you live in another part of the world, there are also climate patterns associated with La Niña and El Niño that you can use to make similar garden plans. You can find them at IRI – International Research Institute for Climate and Society | ENSO Resources and Global impacts of El Niño and La Niña | NOAA Climate.gov.

I hope you have a great growing season and enjoy the fruits and the scents and sights of your garden if you are in the Northern Hemisphere or planning for the next growing season if you are in the Southern Hemisphere far from the equator. We love to see your photos on our Facebook page!

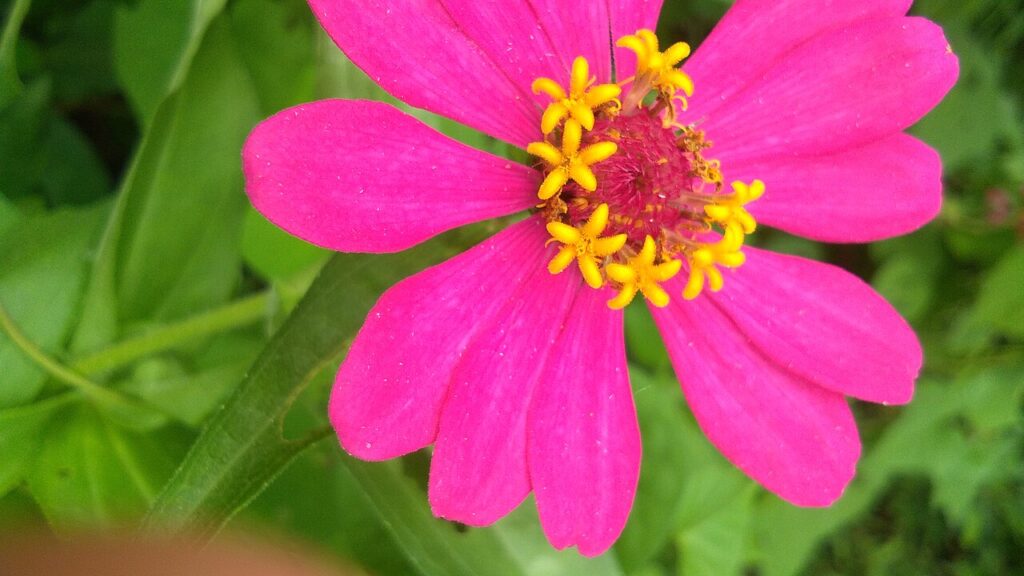
Zinnia Elegans, Muhammad Khaikal Al-Akbarsyah, Commons Wikimedia
Facebook

“Can’t start a fire without a spark”

Facebook

There are many popular songs about fire. Those of you who are fans of Bruce Springsteen will recognize these lyrics from “Dancing in the Dark”. They popped into my head when I was driving home from Asheville NC to Athens GA this past weekend and noticed plumes of wildfires punctuating the air along the highway. That inspired me to write this post on wildfires, which are affecting the Southeast this spring but also affects many areas of the United States and the world too, especially when those areas are in drought. In this post I will discuss how wildfires start, how the local environment may help them spread, and what you can do to protect your properties and gardens from the impacts of wildfires in your communities.

David Sands / Rosebay willowherb leads the way to a ruined building / CC BY-SA 2.0

Wildfires versus prescribed burns

Fires in the environment can be caused by natural events like lightning or can be sparked by human sources. Some fires are set on purpose to clear land and reduce fuel loads so wildfires are less likely to occur and some are caused by ignition sources like sparks from dragging chains, a carelessly tossed cigarette butt, or an untended campfire. Some are set deliberately to cause damage and chaos by arsonists or are the result of careless children or adults. According to Earth.org, “40% of wildfires that affect British Columbia in an average year are human-induced. In the US, the amount is more than double, with nearly 85% of the nearly 100,000 wildland fires that affect North America every year caused by human activities, according to data from the National Park Service.”

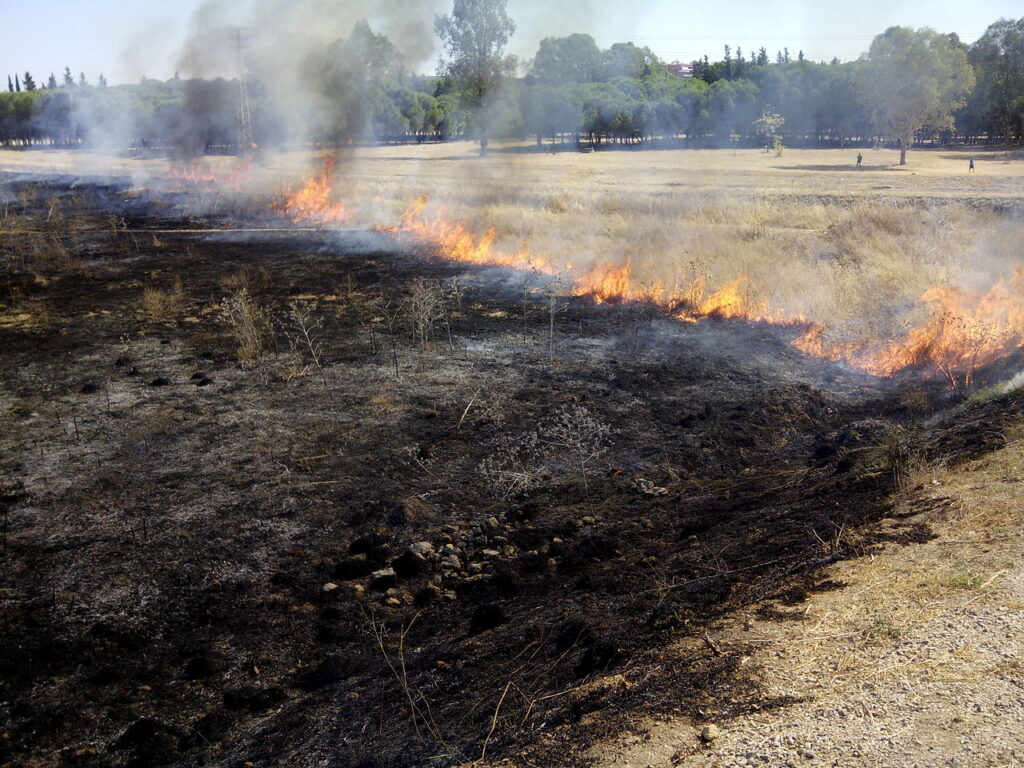
Incendio, Sevilla Este, agosto de 2014, Benjamín Núñez González, Commons Wikimedia.

The fires that are set to reduce fuel loads and remove overgrowth from land are called “prescribed fires” and they are regulated by most states. Farmers sometimes use controlled burns to remove cover crops and prepare for spring planting. Those who want to set a prescribed fire usually have to file a form or follow a procedure to indicate what they are going to burn and when and what the weather was at the time of the burn. They are also expected to file all the necessary permits and notices for smoke and fire hazards. In some states you must be certified to conduct a controlled burn. If the weather is too windy or the humidity too low, they are generally not allowed because the chance of a fire getting out of control is high in those atmospheric conditions. There have been instances of prescribed fires escaping their planned burn areas or causing significant hazards, including a number of deadly multi-car accidents when the aerosols from the fire attracted enough water vapor to form a “superfog” that moved across a busy highway and caused visibility to fall to near-zero feet which blinded drivers speeding down the roads. “Superfog” is especially dangerous if it occurs overnight when the humidity is the highest which causes it to be more dense.

Savannah NWR Prescribed Fire, Judy Doyle, U.S. Fish and Wildlife Service Southeast Region, Commons Wikimedia.

What are the causes of wildfires and how do they spread?

The number one cause of wildfires from natural causes is lightning strikes, especially in areas of drought when the vegetation is very dry and moisture is scarce. Volcanoes can sometimes cause fires by dropping hot embers onto flammable land cover and buildings. Strong winds can quickly spread the fires to new areas downwind and provide a source of oxygen that helps them continue to burn. In areas with a lot of fuel like drought-stricken national forests or open grasslands the fires can rage out of control and cover large areas in short amounts of time.

Lick Fire on the Umatilla National Forest burning at night, U.S. Forest Service- Pacific Northwest Region, Commons Wikimedia.

How to know when you are threatened by wildfire

When conditions are ripe for wildfires, government agencies such as the National Weather Service and state forestry departments will often put out watches and warnings to notify people in areas that are vulnerable to wildfires to be aware of threatening conditions and prepare to evacuate if necessary. If you live in an area that is prone to wildfires, you should make a plan for how to get out quickly and safely and share it with your family and colleagues. If an evacuation order is sent out you should be prepared to move quickly to safety carrying necessary documents, medicines, and valuable property with you in a “go bag” which is assembled ahead of time.

Zones 1 and 2 make up the area immediately surrounding structures on your property. These areas must be well irrigated and consideration must be given to the types of plants used, and the clearance between them | Photo by Courtesy CAL FIRE (from Firesafe Landscaping: Defensible Space – This Old House)

What you can do to your gardens and properties to minimize damage from wildfires

The best way to minimize damage from wildfires is to design your homes with fire-proof or at least fire-resistant materials. In the landscape around your home, plant appropriate plants and keep combustible material at least 30 feet from your home. Create horizontal and vertical breaks in the landscape to slow the spread of flames. Make sure that you have removed low-hanging dead branches and removed any dry shrubs, pine needles, dead grass, and vegetation. You can find additional information on creating fire-safe landscaping here and here. If you live in a fire-prone area you should also be prepared to stay and defend your home if it is too late to evacuate, but this should only be done if you have no other options. If you are able, evacuation is always the best option.

After the fire – other hazards

Hazards caused by fires continue even after the flames are out. Burned-out trees have lower strength and may be prone to dropping limbs or even falling over, creating hazards to anyone or anything beneath them. Ashes may have toxic components that can be carried long distances by the wind or by vehicle tires. In one of my favorite books, The Control of Nature, author John McPhee discusses the debris flows that can occur out west when heavy rain falls on recent fire scars, leading to the destruction of buildings and blockage or destruction of streets and other infrastructure by mud and boulders.

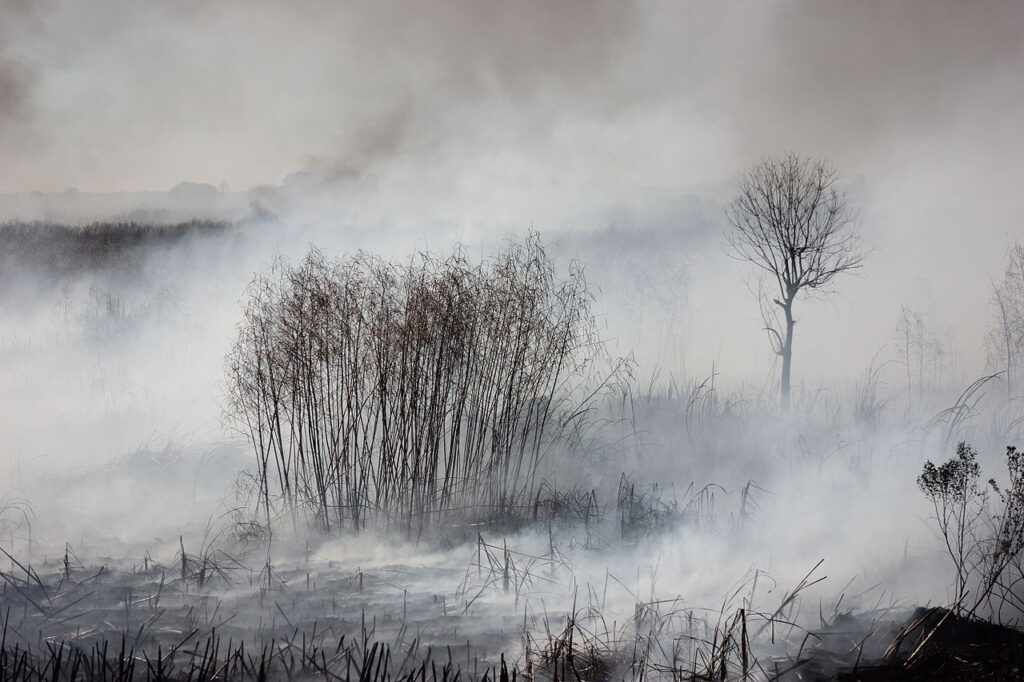
Smoke Plume from the 2024 Adams Fire, US Government, Commons Wikimedia.

Wildfires are a hazard which can affect any place that has flammable vegetation. Take the time to understand what your risk from wildfire is, plan your landscaping accordingly and you will be better protected from this dangerous natural (and sometimes human-made) disaster!

Facebook

Digging into spring planting: The importance of soil temperature and moisture

Facebook

It’s that time of year again (unless you live in the Southern Hemisphere). Gardeners everywhere north of the tropics are thinking about what to plant and when to plant it. Everyone has their own method for determining when to put seeds in the ground outdoors. Many of them are tied to particular calendar dates or to holidays like Easter or phases of the moon. A few are even tied to sayings handed down from grandparents. Some of these methods have some usefulness because the calendar is tied to the seasonal cycle, and so planting on a particular date may be climatologically linked to the average date of the last freeze in spring in that location. Others, like planting at a time related to Easter, for example, seem less useful because Easter is not on the same date each year and using something that can occur on any date between March 22 and April 25 to determine your planting date seems a lot riskier, especially in years when Easter is early. In this week’s blog we will look at the importance of monitoring your soil for temperature and moisture conditions to ensure that your seeds and young plants have the best chance of survival.

Easter lily with pollinator, Alabama Extension, Commons Wikimedia.

Soil characteristics

Every soil has a set of intrinsic characteristics that describes its texture, its acidity, and its organic and mineral composition. It can be further described by environmental qualities including water and air content that give more information about what is in the soil on a daily basis. All of these are important in determining the success of a plant that is placed into that soil. Two of these characteristics that are very important for good plant establishment are the soil temperature and moisture present in that soil sample. Think of it like the “soil weather”, if you will. Soil temperature and moisture can vary a lot over just a few days if a front comes through and drops rain over your garden. In other periods it may not change much from one day to the next especially when temperatures are cool and the sky is cloudy which minimizes the heating of direct sunlight. Sandy soils tend to dry out much quicker than soil with a lot of clay content. The temperature and moisture content turn out to be very important for germinating many seeds and allowing the new plants to grow strong.

Picture of a stagnogley soil, HolgerK at English Wikipedia, Commons Wikimedia.

How does temperature affect germination and plant growth?

Most seeds germinate at when the soil temperature reaches an optimum value for that particular seed type. Our own John Porter discussed how to use this property to start seedlings indoors in spring before the outdoor soil reaches the most favorable temperature a few years ago. But many people make the mistake of using air temperature to decide when to plant rather than soil temperature, because when it feels like spring, gardeners’ thought turn to getting seed into the ground as soon as they can. However, soil temperature often lags the air temperature early in the season and that can lead to seeds germinating very slowly or sometimes just rotting away before they can sprout. Often, it just pays to wait until the soil has warmed up to the most suitable temperature for the seeds you are planting to germinate because your seedlings will be more robust and will grow more quickly.

How to obtain the soil temperature

The best way to get a soil temperature measurement is to do it yourself. There are a number of different inexpensive soil thermometers available to measure the temperature in your own garden plot. You might even find that it varies quite a bit around your property depending on the shading and type of soil you have, just like the local microclimate does. But even if you don’t have a suitable thermometer, there are online sources of soil temperature that can give you a general sense of what the soil temperature is in your area. Even if it is not exactly the same as your own back yard, it is probably close enough for you to judge when it is time to plant.

Thermometer showing soil temperature unshaded in a crop of lentils. Ekalaka, MT., July 2013, USDA NRCS Montana , Commons Wikimedia.

The National Weather Service does not measure soil temperature and moisture at their local airport stations because it is not useful for transportation, but they do provide some soil temperature and moisture information from satellites and other networks’ measurements because it is useful for hydrology, including watching for floods and droughts. Other agencies also collect this type of information. Many states also have statewide mesonets, including the University of Georgia network that I direct, that measure both soil temperature and moisture as well as weather parameters because they are so important for agriculture. Other countries may also measure this information. Keep in mind that the soil temperatures at those individual stations may not reflect exactly what is going on in your backyard because of differences in soil, sunshine, and exposure, but it will give you a general sense of what the pattern of soil temperatures is.

Once you know what the soil temperature is, wait until you know it is going to reach that temperature reliably, not just plant the first day it reaches that temperature. Generally you need about five days of consistent soil temperatures at the target temperature with no forecast for colder weather returning before it is safe to plant. That will help assure you that the seeds are in the best growing environment they can be.

Crocus vernus, Smihael , Commons Wikimedia.

How is soil moisture important?

According to the American Meteorological Society’s Glossary of Meteorology, soil moisture is “the total amount of water, including the water vapor, in an unsaturated soil.” The amount of moisture in the soil is determined by both weather conditions but also the soil type and vegetation in the area. It can be different at the surface than deeper down in the soil where the root zone of the plants is since it takes time for precipitation to percolate down to the areas where the most roots grow.

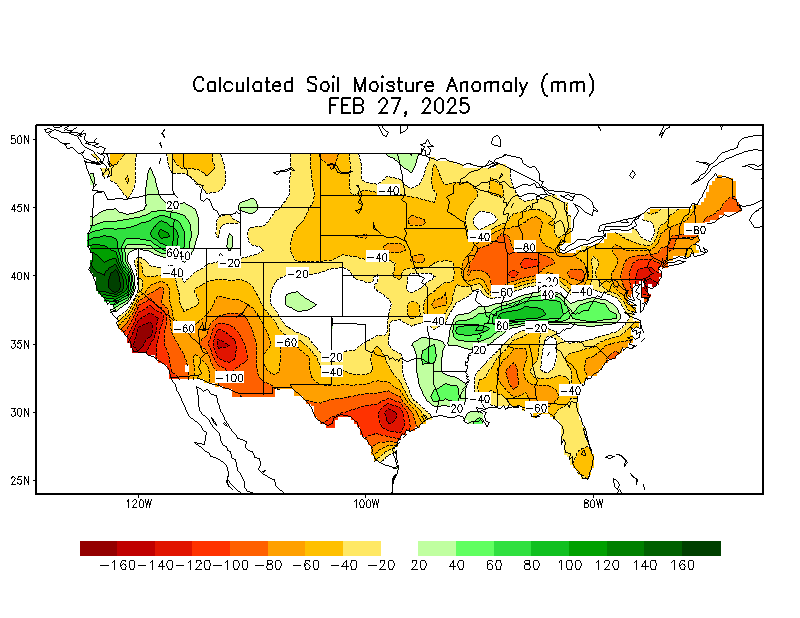
Like soil temperature, many state mesonets measure soil moisture in some way, although not all states do. The map in the link shows the distribution of soil moisture measurements from direct measurements across the Lower 48 states. There are also a number of satellite-detected soil moisture images available. For most gardeners, a general sense of how wet or dry the soil is can be enough to plant successfully. If the soil is too dry, the seeds may not germinate successfully but just sit in the ground until conditions improve and then sprout if they are still viable and have not been eaten. If the soil is too wet, the oxygen content of the soil will be too low because the soil water has filled all the pores in the soil structure, suffocating the new roots of any seedlings that develop. The sweet spot is somewhere in between, with enough moisture to swell the seed and nurture the new seedling without clogging the soil pores with too much water.

Soil moisture anomaly, NOAA’s Climate Prediction Center.

It’s almost time!

Now that you know how to watch for the perfect conditions (or at least close enough!) for your seeds to grow, I hope you will try your hand at doing your own observations of soil temperature and moisture and see what difference it makes in giving your garden the best start. Happy planting!

Petrichor The Smell of Rain, 2140261AishwaryaShinde, Commons Wikimedia.
Facebook

Is snow really “poor man’s fertilizer?”

Facebook

I’ve been thinking about snow and winter precipitation a lot this week as Georgia digs out from a record snowfall that hit the southern part of the state with amounts of up to 9 inches. This is the second snow event this winter, something that does not happen very often here, although I know it is much more common in many other parts of the country and the world. The heavy snow band stretched all the way from eastern Texas to eastern Virginia up the East Coast, bringing record snow amounts to many areas along the path, including a very heavy snowfall in New Orleans. In the past week I have seen references to snow as “poor man’s fertilizer” and I wondered where that came from and whether there was any truth to it. I discovered that it is a saying that is often used by farmers and even turned up in “Farmer Boy” by Laura Ingalls Wilder. The book tells the story of Laura’s husband, Almanzo, growing up on a farm in upstate New York in 1866. His father told him snow was a good thing and called it “poor man’s fertilizer.” We will explore what that means in this week’s Garden Professors blog.

Winter in Copenhagen, Denmark, Stöhrfall (talk), Commons Wikimedia.

Why is snow called “poor man’s fertilizer?”

Snow is sometimes called “poor man’s fertilizer” because, like rain, it can add nutrients to the soil when it falls and sinks into the ground. As snowflakes and rain droplets fall through the atmosphere they pick up trace minerals from dust particles and other nutrients like nitrogen compounds that are needed by plants as they grow. Lightning can also fix nitrogen in rain or snow, although the impacts are limited to areas right near the lightning strikes. The nitrogen compounds include nitrate, ammonium, and dissolved organic nitrogen. It is estimated that between 2 to 12 pounds of nitrogen are deposited per acre in the U.S. per year from rain and snow (at best about ½ pound/acre per inch of snow and usually much less than that). The highest amount of nutrients will occur in the first flush of rain or snow, since once they are washed out of the air, it takes a while for them to build back up.

Lightning contributes 5-10% of the nitrous oxide and the remainder comes from human activity such as emission from automobiles and industrial plants. Ammonium can make up 25-75% of the total N in precipitation and comes from soil microbial activity and manure and urea fertilizer outgassing. Since some of the nitrogen comes from human activity, it is probably no surprise that nitrogen levels in rain are higher in the eastern United States than they are out west due to the prevailing west-to-east winds over the continent. One of the results of this is too much nitrogen falling in some locations, enhancing crop yields but harming forests, waterways, and other natural landscapes.

Garden in snow at Hamarikyu Garden, Snow @ Hamarikyu Garden, Commons Wikimedia

The main benefit of the snowfall is the length of time it takes to melt, since that provides nitrogen to the soil over a longer period and reduces runoff. This is in contrast to rain, which often falls so fast that only a limited amount of the water can percolate into the soil. The rest runs off into streams and lakes resulting in more nitrogen there and less deposited into the ground. And of course snow is free so everyone that it reaches receives benefits at no cost compared to having to purchase and apply commercial fertilizers that add nitrogen to the soil, hence the reference to “poor man”.

Snow on the ground, Cholsey, Bill Nicholls, Commons Wikimedia.

What other benefits of snow cover are there?

In addition to providing moisture and nitrogen to the ground, the snow cover can provide other benefits to your gardens. The blanket of snow can provide an insulating layer between the very cold Arctic air that sometimes blows in from the north and the ground where plant roots and dormant plants are waiting out the winter months, as I discussed in November 2024. If the snow is high enough it can also provide some protection for tree trunks from the nibbles of hungry deer and rabbits looking for winter dining as well as protection for small rodents and other critters that are trying to avoid the eyes of hawks, owls, and foxes, who also need to eat.

Snowfall also serves as an important water source for many communities around the world, storing water in the snowpack in winter and slowly releasing it during the summer for use by communities and agricultural producers downstream. This is becoming a problem as more precipitation falls as rain instead of snow as the climate gets warmer because it changes the seasonal availability of the water. Meltwater from snow can also recharge the groundwater that can provide water through wells. The water from snow can also provide water for animals in winter, who may have limited sources of moisture to survive.

Snow at Hamarikyu Garden, Snow @ Hamarikyu Garden, Commons Wikimedia.

What limits are there to fertilization by snow?

Snow does not always provide much benefits to gardeners and farmers. If the ground is already frozen the meltwater may not be able to penetrate the surface and will run off before it can enhance soil nitrogen. If the soil is too permeable, the meltwater may sink down so deep that plants cannot reach the nutrients until later in the season when their roots stretch down to deeper levels, if at all. Even with a consistent snowpack over time, the amount of nitrogen that is able to infiltrate the soil is highly variable.

Enjoying the snow

While snow does provide some fertilizing effect due to the presence of nitrogen in the meltwater, the amount is not large. It’s highly variable due to the amount of dust picked up by the snowflakes as they fall through the atmosphere as well as how much and how fast the snow melts when it hits the ground. If the ground is frozen, very little may make it to the root zone. Testing your garden soil for nitrogen content each spring will allow you to determine how much nitrogen is already there and how much should be added using commercial fertilizers to provide the optimum levels for plant growth. But whether or not snow really is “poor man’s fertilizer”, it provides nourishment for the soul as you see this enjoyable and beautiful contrast to the greenness of your summer garden.

Frozen fruits of Rosa rugosa covered with snow, Alexey V. Kurochkin, Commons Wikimedia.
Facebook

2024 in Review and a look ahead to 2025

Facebook

How did your garden grow in 2024? Was it a lush playground full of beautiful flowers and plentiful produce? Or was it a sere landscape of brown, wilted foliage? How your own garden fared in 2024 was certainly dependent on where you live, what you had planted, and how you took care of it, but it was also subject to the variations in weather and climate in your area. This week we will take a look back at the climate conditions in 2024 and look forward to what it might mean for 2025. Now is the time to look at your seed catalogs and dream!

Christmas at Longwood Gardens, 2021, PLBechly, Commons Wikimedia.

What controlled the climate this year around the world?

With just a few days to go in 2024, it is quite clear that this will be the warmest year we have ever measured since official global records began in 1880. There are three main factors that controlled the climate in 2024, although of course there are also local variations due to smaller-scale weather events. The contributing factors are the warming trend across the world caused by greenhouse warming of the planet, the El Niño that dominated the Eastern Pacific Ocean in the first half of the year, and the unusual warming of the Atlantic Ocean this year which provided fuel for the growth of Atlantic tropical cyclones this year as well as raising the global temperature.

Impacts of the rising temperature trend

Rising temperatures for the world are well-documented by scientists across the globe and are generally linked to increases in the amount of greenhouse gases like carbon dioxide and methane from sources like the burning of fossil fuel. This is not a new concept and can be found in scientific literature going back to at least 1856 when Eunice Foote discovered that carbon dioxide trapped heat in her home laboratory. Many scientists since then have corroborated that effect and others have shown that the primary source of greenhouse gases like carbon dioxide is the burning of fossil fuel, although there are other sources as well.

Source: National Centers for Environmental Information, NOAA.

A timeline of global temperature for January through November (we don’t have the values for December 2024 yet since it is not quite over) shows that this is almost certain to be the warmest year on record so far. But since temperatures are still rising, we can expect to see more record-setting warm years in the future. The rise in global and regional temperature that is occurring now may not be apparent on a day-to-day basis due to short-term variations caused by passing weather systems, but the changes are reflected in increases in normal temperatures when they are updated every ten years. Longer-term changes like the drift in Plant Hardiness Zones also reflect this upward trend. Heat waves across Northern Europe and in South America in 2024 have also been attributed in part to the warming trend. Of course, winter will still occur and we will continue to get cold periods, just fewer of them than in the past.

Winter flowers, Carol (vanhookc), Commons Wikimedia.

El Niño to neutral conditions

The second major impact on the climate in 2024 was the lingering El Niño that was occurring as 2024 began and lasted until early June. The warm water in the Eastern Pacific Ocean associated with El Niño helped raise the global temperature during the first half of the year and affected the climate around the world. In North America, an El Niño is associated with warm dry conditions at high latitudes and wet cool conditions in southern latitudes as the jet stream is shifted to the south, bringing storms, clouds, and rain along with it. Once the El Niño ended in June, neutral conditions prevailed until the end of 2024, although the last few months we almost reached the threshold for the opposite phase, La Niña. Climate patterns associated with La Niña were starting to appear late in 2024, leading to dry conditions across southern parts of the United States and wet conditions farther to the north. In fact in the Southeastern US most areas were in drought for a good part of the summer except areas that were hit by tropical cyclones like Beryl, Debby, Francine, Helene, and the remains of Rafael. By the end of 2024, over 87% of the lower 48 states were covered by drought or abnormally dry conditions, a big change from early in the year.

Source: National Drought Monitor.

Notable droughts also occurred in Brazil and other parts of South America and in northern Europe. These droughts were also associated with record-setting warm temperatures as high pressure over those areas tamped down any development of rainstorms and caused clear skies which increased temperatures. You can look at maps and timelines of specific areas of the world or country at https://www.ncei.noaa.gov/access/monitoring/climate-at-a-glance/. The map above shows how the drought status in the US changed over the year with some areas getting much wetter and others drying out. Note that areas with tropical storms and atmospheric rivers this year experienced a lot of changes from month to month but it did not affect the total change over the year by much.

Record-setting warm temperatures in the Atlantic

The third impact on this year’s climate was the abnormally warm temperatures in the Atlantic and Gulf of Mexico. These record-setting temperatures have been linked to decreases in aerosols from burning of fossil fuels by ships crossing the ocean and in more recent literature, to decreases in low clouds over the ocean. Both of these can lead to more sunlight reaching the surface of the ocean and increasing its temperature. Those warm sea surface temperatures led to a larger number of tropical systems than usual in the Atlantic Ocean by providing a source of fuel that helped them develop into full-fledged tropical storms and hurricanes. There were 11 hurricanes and 18 named storms in the Atlantic Basin this year, the 5th largest number in the satellite era. The number and intensity of tropical cyclones in other parts of the world like the western Pacific are also attributed in part to warmer ocean water. The Philippines experienced five different typhoons in just a few weeks, causing tremendous damage there, and other areas of Southeast Asia also felt the impacts of tropical systems.

What do we expect in 2025?

By January I expect that the La Niña will be officially declared. Whether or not it is, though, we can predict that the early part of the year will show the characteristic pattern of a weak La Niña, including a shift to the north for the jet stream over the United States. That will bring cloudy and colder weather to the northern states and warmer and drier conditions to the southern states since the jet stream is what is pushing our precipitation-producing systems around. These conditions will likely be reflected in the soil moisture present during the spring planting season, so I expect dry conditions in the Southeast that could affect germination of seeds. Wetter conditions in the North should not have this problem but farmers could have trouble getting into the fields to plant if it is really wet and cool, leading to delays in establishing crops. This La Niña is likely to be fairly weak, so it may only last for a few months before we return to neutral conditions. NOAA’s predictions are that the neutral conditions are likely to last for most of the summer. That means we are likely to get another active Atlantic tropical season. The South could be fairly dry except where the tropics bring storms to the area again in 2025. If you are in other countries, you can find more information here or check with your local authorities for how your region usually responds to a La Niña in winter and later in the year.

How did your garden do in 2024? What are you looking forward to in 2025? Let us know in the comments. We are happy to get your questions, too, as we plan for our blog posts in 2025. Many thanks for the comments we have received in this past year and for your support of our blog! We appreciate it!

Cyclamen, Wilhelm Zimmerling PAR, Commons Wikimedia.

Facebook

Underneath a blanket of snow

Facebook

I am writing this post on Thanksgiving Day, and I can hear football in another part of the house while I sit here with cat in lap. Here in Georgia, we are still officially in the growing season, although that will end in the next few days since a cold front has pushed through today, ushering in much colder conditions that will result in temperatures in the mid-20s next week. It will be a while before we see snow, though, and in fact we only get it every couple of years in Georgia, so we may not get any snow at all this La Nina year, since La Nina winters are usually warmer and drier than usual in the Southeast. Many of my friends from more northern areas have already experienced killing freezes and even snow so today I want to talk about how snow on the ground affects your gardens.

Garden detail covered in snow, Carol M. Highsmith Archive, Library of Congress, https://cdn.loc.gov/master/pnp/highsm/13100/13199a.tif

What does the phrase “blanket of snow” mean?

When you hear the term “blanket of snow”, what does it mean to you? To me it means enough snow to completely cover the ground. Quora says it is a metaphor: “Everything is or was covered with snow thick enough to hide the actual objects and their shapes like a blanket would hide the objects it was covering.” Certainly, a thick enough covering of snow will mask the shapes of objects underneath it, just like the blanket on my bed hides the outlines of my legs. But I also think of a blanket as an insulator that keeps heat trapped underneath it and a blanket of snow can also do that for the ground beneath it. Snow also has weight, an early snowfall landing on autumn leaves can quickly strip a tree of its leaf cover if the snow is heavy enough to release the leaves from their branches. Linda has discussed damage to garden trees and shrubs from snow in a previous post.

Blanket of snow, Emilian Robert Vicol, Commons Wikimedia

When does snow form and fall?

Snow can come from several weather sources. In a previous blog post I discussed lake effect snow, and this week is likely to have some very big lake effect snows downwind of the Great Lakes (up to 5 feet!) because of the combination of very cold air with the record-setting high temperatures the Great Lakes are experiencing this year. Snow can also be caused by upward motion of moist air over elevated land, which becomes snow when it rises above the freezing level and drops precipitation on the mountains. For most people, snow comes when a large area of low pressure brings cold air into contact with warmer moist air at the surface. The dense cold air causes the lighter warmer air to rise over it. The air temperature drops as it goes up leading to bands of snow where the cold air and the moisture meet. If the cold air lags behind the surface low pressure, then it is unlikely to cool off the moist air enough to get snow and you may get a cold rain instead. This is the most likely way most of us will get snow if we don’t live near a large lake or mountain range.

How does snow insulate the ground?

Snow insulates the ground from the cold air above the snow by trapping air within the snow cover. This is not unlike how a down comforter works. The snowflakes fall against each other in random orientations that leave a lot of air between the individual flakes. The trapped air serves as a barrier between the really frigid air that is over the surface of the snow and the soil beneath it. In some cases, the snow is so effective at insulating the soil that the soil temperatures can be above freezing while the air above the snow cover is much colder. This is especially true when the skies overhead are clear because the top of the snow radiates thermal energy up to space very effectively when there is no cloud cover. If the soil stays above freezing, then pests and weeds will continue to live in that soil until a longer freezing spell comes along later in the winter when the ground is less protected by the snow. However, the insulation can protect from the desiccating effects of very cold, dry air on the plants that are waiting under the surface for spring temperatures to bring them back to life. A winter drought in the wheat fields of the Great Plains can lead to severe damage to the winter wheat crop since the lack of insulating snow cover leads to soil temperatures too low to sustain the wheat plants into the next growing season.

A bunch of snowflakes, Calgary Reviews, Commons Wikimedia

The amount of insulation snow cover provides depends on the density of the water in the snow cover. You can think of this as the ratio of snow depth to snow water equivalent, the depth of water that the snow would have if you melted it and measured the water volume that was left. Typically, the ratio of snow depth to water equivalent is roughly a 10 to 1 ratio—in other words, 10 inches of snow is equal to 1 inch of liquid water. But that varies widely depending on the temperature and weather conditions at which the snow occurred. A heavy lake effect snow near 32 F can be a ratio more like 6 to 1 while a really cold Arctic or high-altitude snow can be more like 15 or even 30 to one, resulting in a very fluffy snow that is dry and powdery with the snow crystals barely sticking to each other.

Different shapes of snowflakes affect snow cover density

The difference in the ratio of snow depth to water equivalent is due in part to the different shapes that snow crystals form depending on what the temperature and relative humidity are where they are forming in the atmosphere. The snowflakes that grow in the highest humidity levels and form near freezing are called dendrites. These are the typical snowflakes depicted on Christmas cards and in children’s books, with six-armed patterns that can be very ornate and beautiful. The dendrites usually cause the fluffiest snow covers because the edges of the flakes are rough and catch against each other, resulting in a lot of space between the flakes. Other shapes of snowflakes are denser and are also smoother, resulting in a closer packing of snow crystals that lead to a tighter snow cover. The longer the snow cover sits on the ground, the more dense it becomes as the rough edges of the snowflakes melt and smooth out, resulting in a tighter packing of the snow cover that becomes heavier and harder to shovel.

https://www.snowcrystals.com/morphology/SnowflakeMorphology2sm.jpg
Snow crystal morphology, https://www.snowcrystals.com/morphology/morphology.html.

For gardeners, a blanket of snow can be not only a thing of beauty but a way of protecting your garden plants from the most extreme cold air. It can also be a way of providing moisture that will be needed by the growing plants in spring once the next growing season begins. So if you get snow, enjoy it as it covers your winter garden but also walk and drive safely if you have to go out in it. If you live in an area that does not get snow, enjoy the pictures that others post on social media and think about how a blanket of sparkling ice crystals might look in your garden.

Coming up in December: end of year summary

I plan to post a summary of the 2024 season in my December blog post. There is a lot to talk about this year, not just in the Southeast, and I hope to cover a good bit of it in that article. In the meantime, happy Thanksgiving to those of you in the United States and a happy Christmas and holiday season to all who celebrate it.

Snow on last year’s flower, Axel Kristinsson, Commons Wikimedia.
Facebook