I probably shouldn’t admit this but one of my all-time favorite movies is Steve Martin’s classic “The Jerk”. Part of the appeal is that I have an affinity for low-brow humor in general but also because the movie contains some great lines; “I was born a poor black child”, and the classic scene when Martin’s character finds his name in the phonebook for the first time and runs around yelling, “The new phonebook’s here! The new phonebook’s here!” http://www.youtube.com/watch?v=kOTDn2A7hcY
I wasn’t quite as excited as Navin R. Johnson today, but pretty darn close. The reason? The USDA (finally) released a new hardiness zone map for the US. http://planthardiness.ars.usda.gov/PHZMWeb/
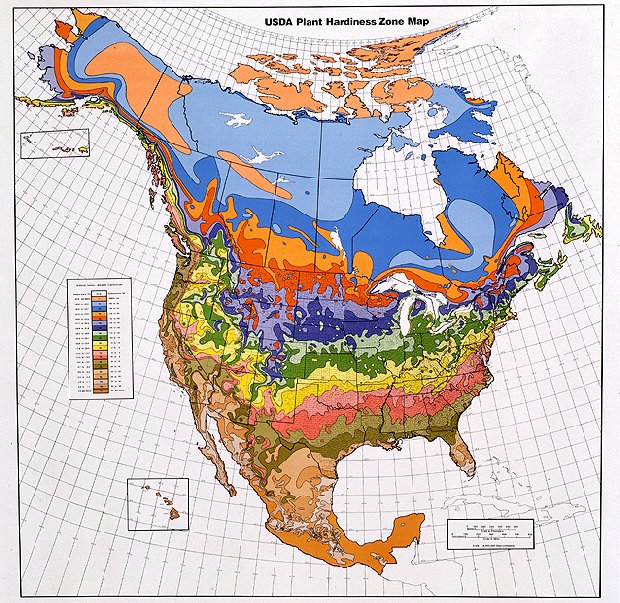
Why is this exciting news? Well, for several reasons. The earlier version of the USDA map was released 1990. The 22-year-old map had several limitations. First, it was 22 years old. Secondly, the versions of the map that were available electronically did not reproduce well and had poor resolution when you tried to zoom in on a particular area. This sometimes made it difficult to identify the hardiness zone for certain locations and limited the utility of the map for presentations and publications.
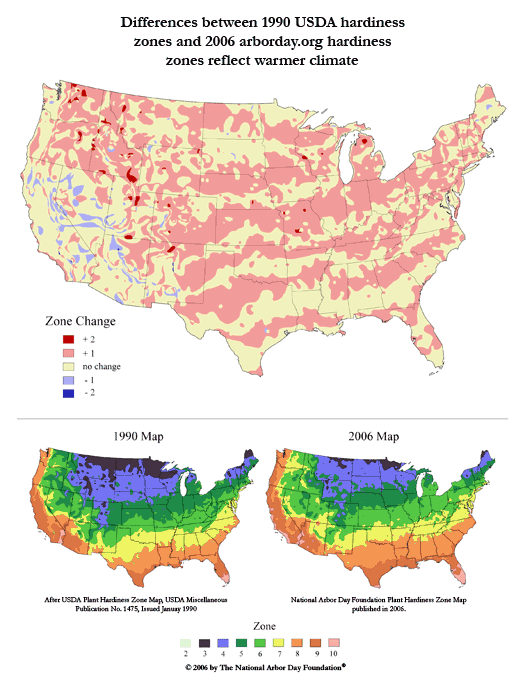
There have been persistent rumors for last 6 or 7 years that the USDA would release a better, updated map. In addition to the shortcomings of the old map in terms of resolution, many felt the map didn’t accurately reflect more recent climatic conditions. In 2006 the National Arbor Day Foundation released an updated hardiness map using more current climatic data. This map indicated that many locations were 1 or even 2 hardiness zones warmer than the 1990 USDA map. In addition, the Arbor Day map was available as a hi-res TIF file suitable for PowerPoint presentations and had a ‘zone-finder’ feature based on zip codes.
I haven’t had a lot of time to work with the new USDA map, but my initial reaction is a thumb’s up. Like the Arbor Day map, the new USDA map has a zone finder based on zip code that makes it easy to find the zone in your area. The map is interactive, allowing users to zoom in or out. As with MapQuest and other on-line maps we’ve grown accustomed to, it allows the user to select a roadmap or satellite background and choose different levels of transparency or opacity.
Whenever I discuss hardiness zones, I always include the caveat that these maps are based on average annual minimum temperatures. That is, they are based low temperatures we are likely to see in an average year. Not sure about where you live, but I have yet to see an average year in my adult life. There are many years when we will get below our USDA hardiness zone temperature. Human nature says we want what we can’t have and gardeners love to push the boundaries of their hardiness zone – people in zone 4 love to grow zone 5 plants; people in zone 5 love to grow zone 6 and so on. Just because the new map may say you’re a zone warmer; your climate hasn’t changed, the map is just based on better and more recent data.
And let’s not forget, as I frequently explain to my customers, all that this map does not tell us for our gardening decisions. I see a great swath of the Nevada Great Basin country is the same zone as my patch of northeastern Kansas. Summer temps, rainfall, soils and soil chemistry, elevation all have a role to play in the garden.
Henry Mitchell’s first rule of gardening: “You have to garden where you are”.
I agree with the above comment. Also, in my experience, I would not place the Chicago area as zone 6 as the new map indicates. I would still place it as a zone 5. Just wondering what you think?
I guess I’d better tell my friend that she might as well dig up the crepe myrtle she’s had growing in her backyard here in Syracuse for more twenty years as a cut-back shrub (similar to Russian sage, caryopteris, buddleia, etc.) because according to the new map it’s still not hardy any further north than Pennsylvania! I’m in complete agreement with Brian and Lisa above, as well as all others that will chime in with similar comments. This mapping effort gives many consumers a false sense of security and enables many plant purveyors market a plant based solely on it being “hardy in Zone XYZ!” An absolute minimum temperature of -20F within days of a two week stretch of +50F and +60F temps during a midwinter thaw isn’t the same as -20F following a two month stretch of consistently normal to below normal temps during an especially cold winter – just like -20F ambient air temps don’t have the same effect on herbaceous perennials buried under three feet of snow as -20F would effect herbaceous perennials in bare ground. No offense, Bert, but I just don’t understand how knowledgeable horticulturists can give this effort much credibility?
Lisa:
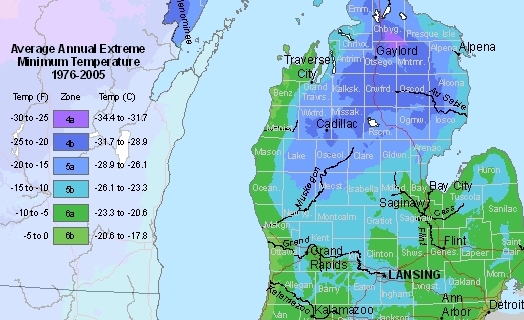
The zone 6 around Chicago probably reflects a couple of factors. One, the proximity to Lake Michigan – though this effect is stronger on the west side of Michigan. Note that we have a swath of zone 6b right along the MI coast. Secondly, is the urban heat island effect. Hardiness zones are modeled based on temperature records from weather stations in the area. The ones in town will consistently give warmer data and push the hardiness zone up. If you live in the suburbs, I agree, your climate could be colder than the hardiness zone.
Terry:
No offense taken! I think everyone that stops and thinks about it (important caveat) realizes there are limitations to hardiness zones. As I pointed out, they reflect long-term average conditions that can sometimes be exceeded. As Lisa noted, there are micro-site effects that can create artifacts in the model. And, and you indicated, it is not always minimum temperatures that cause problems for plants but temperature fluctuations. Then you get into issues of ‘marginally hardy’. If something survives as a cut-back shrub is it truly hardy in your area. Hardy enough for you to enjoy and that may be all that matters. So, with all that ‘baggage’, what’s the value of having hardiness zone maps? In my mind there are a couple things that make them useful. First, from an ecological and a horticultural perspective, winter minimum temperature is the primary factor that will determine where a plant will grow. Of course there are others; rainfall, high summer temps, but if a landscape plant can’t make it through the winter – it’s a non-starter. Second, we can get around some climatic limitations (I can irrigate if my climate is too dry for a certain plant) but we can’t get around low winter temps without extraordinary effort (building a greenhouse). Lastly, hardiness zones give us a common frame of reference. If I say I live in zone 5, most people reading this blog in the US will have some sense of my climate, at least in the winter. I certainly understand your point of hardiness being used to peddle plants that have other limitations but if I give plant talk, the first questions I get will be: 1) How big does it get? and 2) What zone is it?
Adrian Higgins covered the topic in today’s Washington Post. This is my favorite quote:
“The sophisticated gardener can’t just rely on the zone map, and what’s the fun of that?” said Todd Forrest of the New York Botanical Garden (now in the same zone as Washington). “If you can’t plant things you’re not supposed to grow, you’re not having fun as a gardener.”
“The sophisticated gardener can’t just rely on the zone map, and what’s the fun of that?” said Todd Forrest of the New York Botanical Garden (now in the same zone as Washington). “If you can’t plant things you’re not supposed to grow, you’re not having fun as a gardener.”
Ray: or as one of my favorite plant sayings goes: “Been there; killed that”
I’m still trying to get rosemary to overwinter here, mostly unsuccessfully…
This gives me hope that the Japanese maples and evergreen magnolia’s I’ve been shopping for with my fingers in my ears might have a chance of long term survival after all. — Like you say, we’ve all been doing this stuff anyway. Maybe we aren’t as good at finding ‘microclimates’ as we thought we were, it’s just warmer than we realized everywhere.
It appears that my zone has moved up from 7a to 7b (or at least, we are on the border now). That said, the changes to the map aren’t going to effect the plants that are going into the new garden. But, I am always for having the best and newest resources available and the updated map is long overdue.
Cheers!
Drat! I missed being in Zone 9a by just five blocks!