Last week I decided to continue my discussion on cold hardiness and so now, of course, temperatures are forecast in the mid-70’s for this week. Oh well, I’m still convinced we’ve got one more blast of winter to go and some of this will still matter to someone.
One of the questions posed in response to last week’s post was how much cold hardiness changes during the winter. Before I get into that, it’s good to review how cold hardiness can be quantified. Cold hardiness is essentially how much cold a plant can withstand before it suffers damage. There are two common ways by which this can be measured. The simplest and most straightforward method is through a whole plant (or whole shoot) freeze test. In this test, entire plants, usually seedlings, are placed in freezer that is programmed to drop the temperature progressively colder, say from 3 deg C to -36 deg. C
At set intervals, often 3 deg. C, a group of plants are removed. The plants are allowed to slowly thaw and are then examined for needle damage or bud kill. At the warmest temperatures, plants are undamaged. As we examine plants subjected to colder temperatures, we’ll begin to find some with damage. Eventually we’ll find a temperature where all the plants are damaged. When we plot the percent of damaged plants versus temperature we can identify an LT50, or lethal threshold where 50% of plants are damaged.
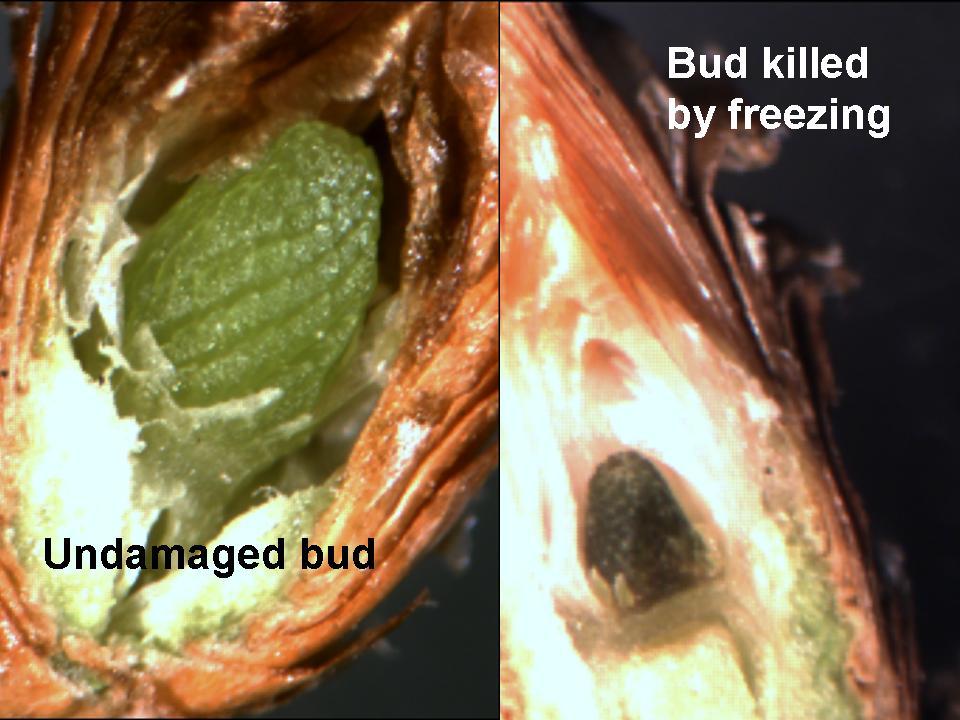
Examples of determining bud damage during whole shoot freeze tests.
The second common assay for cold hardiness is termed Freeze-induced electrolyte leakage or FIEL. FIEL testing is similar to the whole plant freeze test except that instead of freezing the entire plant or shoot, just a small portion of tissue, such as a conifer needle segment is needed. The FIEL test is based on the fact that plants can withstand inter-cellular ice (ice between cells) but not intra-cellular ice (ice within cells). When intra-cellular ice forms it disrupts the cell membranes and cell contents are released into solution. The amount of leakage of cell contents into solution can be easily measured using a standard conductivity meter. Again, we can estimate an LT50 by plotting the amount of damage versus exposure temperature.
By assessing cold hardiness periodically through the winter, we can assess changes in hardiness associated with acclimation and de-acclimation processes. A classic study by Karen Burr and her colleagues demonstrates how quickly acclimation can change. In their study they tracked cold hardiness of conifer seedlings that we exposed to acclimating conditions (short days and progressively colder temps) and then de-acclimating conditions (longer days and warming temps). The resulting chart demonstrates how dynamic cold hardiness can be. When we describe plans based on Hardiness zone we’re talking about their maximum hardiness or the temps they can stand in the mid-winter period. But note how quickly the lethal temperature rises during de-acclimation.
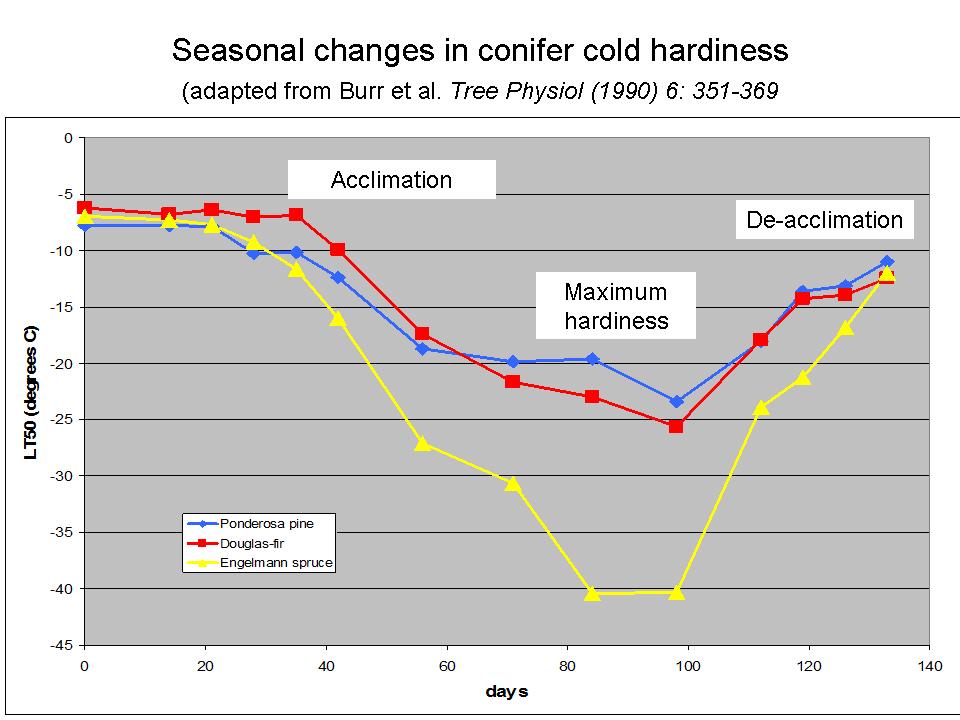 Seasonal trend in phases of cold hardiness: Acclimation, Maximum hardiness, and De-acclimation
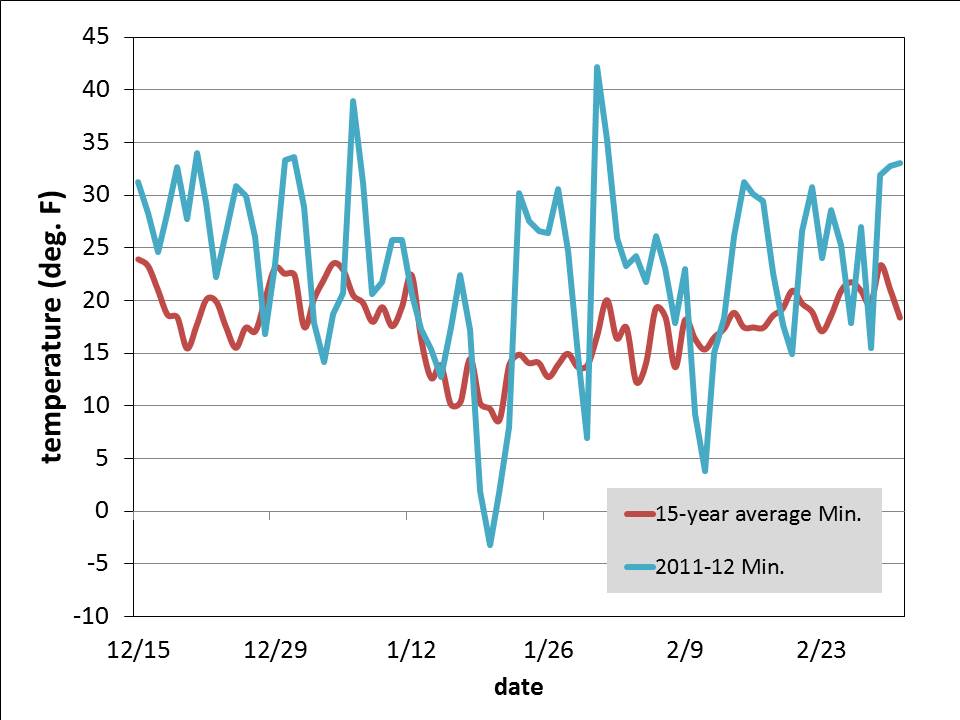
Typically, our most common winter injury problems occur during the de-acclimation phase as temps warm and hardiness is lost. We saw a dramatic example of this several years ago in western Michigan when an early March warm-up with temperatures in the 50’s F was followed by nights with temps as low a -5 deg. This resulted in widespread bud-kill in conifer plantations. With a week of highs in the 60’s and 70’s forecast, it’s easy to see why our current warm-up has everyone nervous.
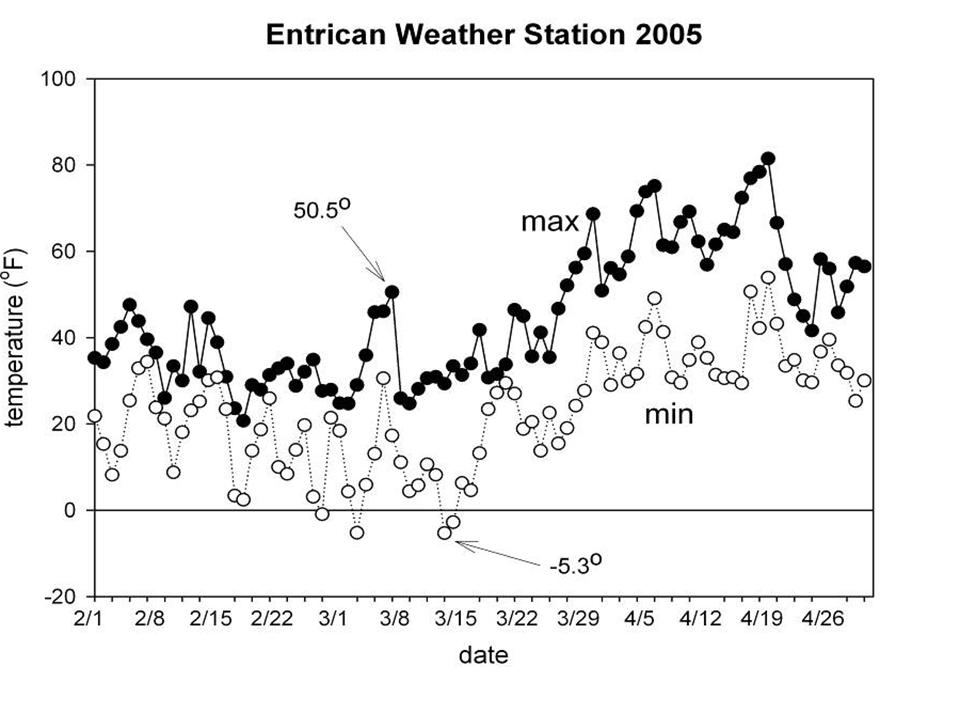
Maximum and minimum temperatures from a west Michigan weather station