The cooler weather that many parts of the eastern United States are experiencing this week is causing many gardeners to think about what this fall will be like. In fact, many farmers in Georgia are already planting fall crops, and I am sure that many gardeners are also busy with their own fall planting if they live in the Northern Hemisphere mid-latitudes. In this blog post we will discuss seasonal forecasts and how you can use them to plan and plant your garden.
Sumac turning orange in early fall, ShenandoahNPS, Commons Wikimedia.
What kinds of long-range forecasts are available?
In weather and climate, there are two basic types of forecasts. The first is a deterministic forecast, which gives an outlook that describes the specific weather that is expected to occur at a discrete time in the future. Deterministic forecasts are commonly used for weather forecasts for the next few days and are based on computer model predictions that are grounded in the physical equations of motion, thermodynamics and other properties of the atmosphere. Generally, deterministic forecasts are most useful within a few days after the forecast is made. As you go farther out in time, they become less accurate due to lack of updated weather observations and drifts in the models due to the chaotic nature of the atmosphere. In general, a deterministic forecast is not very accurate more than a week ahead of when it is made. They are better than they used to be, and the accuracy of a 7-day forecast now is as good as a 5-day forecast was a couple of decades ago, but we will likely never have a perfect deterministic forecast more than ten days out.
Longer-term forecasts are usually given as probabilistic forecasts. In other words, the forecast will give a likelihood of occurrence of general weather conditions such as wetter or drier and colder or warmer than normal. For meteorologists, “normal” is a 30-year average of temperature and precipitation at a location and is currently based on the 1991-2020 period (they are updated every ten years due to the amount of work it takes to produce a clean dataset). Most probabilistic forecasts are based on multiple model results that start from slightly different conditions and are built with different methods of creating rain and clouds, moving temperature and humidity around, and start with different surface conditions. The more the models agree, the higher the probability of occurrence of a particular type of weather.
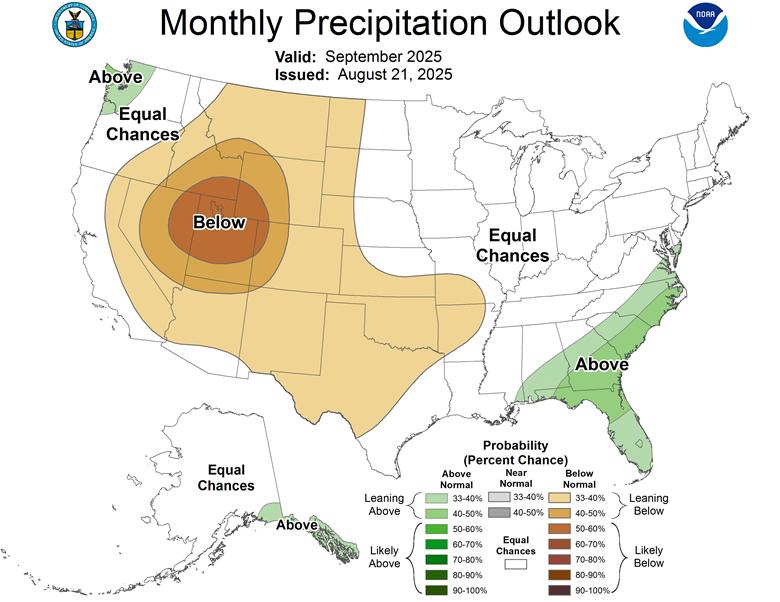
How to interpret the NOAA monthly and season forecast maps
In the NOAA map for September 2025 above, for example, there is a dark brown area centered on the Great Salt Lake in the western United States. This is an area that has a strong probability of being drier than normal in the month of September based on the available model output. The fact that it is dark brown does not mean it will necessarily be much drier than normal, but that we have a strong likelihood that it will in the lowest third of years in terms of how many inches of precipitation it is likely to experience. These forecasts start from even odds of having near normal precipitation (34%), above normal precipitation (33%) and below normal precipitation (33%). If the climate forecast models indicate mostly dry conditions at a point, then the percentages shift to something more like 34% near normal, 50% below normal, and 16% above normal precipitation. Because there is so much uncertainty in the atmosphere, you never know with total accuracy which category the season will fall into, you just have some confidence of which way it is likely to fall. Since this is the average for an entire month or season, there can be periods within that time span that are significantly different weather that what the probabilities suggest are the most likely to occur. Here is a list of what the seasonal forecast maps do NOT tell us.
If you are planning an outdoor event like a garden wedding months ahead, a deterministic forecast is what you would probably want to know. Do we need to rent a tent? Should we expect hot or cold weather when we purchase a dress? Unfortunately, this is not possible a long time ahead and so you need to use previous or average weather conditions on that date to decide what kind of weather is most likely to occur and be aware that you could be wrong. There are a few commercial forecasting sites that provide specific deterministic forecasts up to 90 days ahead. I asked a friend who works for one of these companies why they do it when research shows that there is no skill involved, and he told me they do it for “entertainment value.” In other words, it is not real information, it is just click-bait. The same thing happens with wild hurricane forecasts on social media that show a single deterministic forecast of a huge storm hitting somewhere like Tampa, conveniently not showing the 99 models with no such storm present. Don’t believe them, they are harvesting clicks, not providing useful information.
Early fall leaf against sandstone, cogdogblog, Commons Wikimedia.
The Farmers’ Almanac and the Old Farmer’s Almanac
Every year, including this one, publishers release almanacs each fall which claim to show what the weather will be like for 1 to 3-day periods for the winter and next year. Their winter outlook maps get a lot of press about what to expect weatherwise for the next few months (I won’t post any links in this post but you can search online if you are really curious). If you read them carefully, you can see they are quasi-deterministic since they reference storms or heat waves occurring at specific areas over just a few days, although they are usually written in broad enough language that they can be interpreted in several ways. Many people use these for planning their gardens, and they do contain useful information about climatological conditions, average frost dates, and sunrise and sunset information. But scientists have shown that they are only about 50% accurate, which amounts to pure chance. They base their forecasts on secret formulas that cannot be scientifically studied or verified so we have no way to know what they are really using to determine what those forecasts will be. So if you buy one this year, I challenge you to keep track of what they forecast and what weather actually occurred at your house and see if they did any better than chance in 2026. Let the buyer beware and use them for “entertainment value” only.
What can we expect this fall?
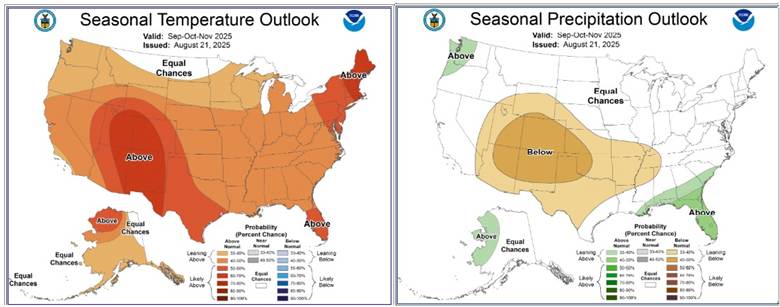
Based on NOAA’s probabilistic forecast, we can expect the temperature across most of the United States to be warmer than normal, with some areas more likely to be warm than others. This is likely due to the continuing greenhouse warming that is occurring, making every year (on average) warmer than the previous one, although there is a lot of variation within that trend from one year to the next. Precipitation in the Southeast for the September through November period is leaning towards wetter than normal conditions, and that is probably related mostly to the second half of the Atlantic hurricane season, which could bring heavy rain to parts of the Southeast during fall even though parts of it will certainly be missed. The southwestern United States centered on the Four Corners area is expected to be drier than normal in an area that is already quite dry climatologically.
For the December through February period, the forecast is showing a pattern of climate conditions that is consistent with the La Nina that is expected to occur as we head into winter, with warmer and drier conditions in the southern US and wetter and cooler conditions in the northern US. If you live in a different part of the world, you can find images of the expected La Nina conditions here. Choose plants according to the climate conditions you expect and be prepared to manage them for those conditions, so that if you are in the South, you may have to water more frequently because of the drier than average conditions.
Seasonal outlook maps can provide clues to the kind of temperature and rainfall conditions you are likely to experience in your neighborhood over 3-month periods, although they will not give you specific details about when the first frost might occur or how many heavy rain events you can expect to see. But knowledge of the likely pattern of conditions you can expect will allow you to plan what kind of plants to put in the ground and how you are likely to have to take care of them as they grow.
Just an additional note: If you like to track the fall colors, check out this interactive fall foliage map at https://www.explorefall.com/, now including Alaska. It’s a great resource for planning weekend trips to areas you think will be experiencing beautiful fall foliage.
Backlit grass in the early fall at Shenandoah Valley Outlook, ShenandoahNPS, Commons Wikimedia.
Pesticide residues and risk assessments have been a major topic of interest and inquiry for me for over a decade, and something that I wanted to write about on the Blog for quite some time. Over the past couple of months, I have had several inquiries from people regarding the “Dirty Dozen” list, so I thought this was the perfect time to organize the evidence-based data on this topic. To see a prior post on this topic, you should also check out Jeff Gillman’s post on the Dirty Dozen from 2010 and a follow up post from 2011.
Before diving too deeply, I wanted to acknowledge some of the articles and resources that I leaned heavily on while putting this post together. These include an excellent article by University of California Davis Extension Food Toxicologist Dr. Carl Winter on pesticidefacts.org, and an article authored by multiple experts from University of Arkansas Division of Agriculture Research & Extension (Dr. Amanda McWhirt, Dr. Jackie Lee, and Ples Spradley). Since both of these articles are over 5 years old, I have updated some of the information in my post to reflect any changes in the science and methodology since the time their articles were published. I also want to acknowledge that much of the regulatory information that I will be sharing within this post will pertain to agriculture in the United States, and for more detailed information on this topic pertaining to other countries, I strongly encourage you to seek out evidence-based resources and/or reach out to knowledgeable experts.
What is the ‘Dirty Dozen’
Aside from being a great World War II film from the late 1960’s, the term ‘Dirty Dozen’ also refers to a consumer-focused publication put together by an environmental advocacy group based in the United States. The Dirty Dozen is a list of 12 produce items (fruits and veggies) that allegedly contain the highest pesticide residue levels (dubbing them to be the ‘dirtiest’). This list is developed annually by the Environmental Working Group (EWG) with rankings that are based on United States Department of Agriculture’s (USDA) Pesticide Data Program (PDP) report. Although this sounds important and valuable to share with consumers, the information contained in these lists is derived through problematic methodology, disseminated using a lack of complete and evidence-based data, and results in unnecessary fear and uncertainty surrounding the consumption of fruits and vegetables that can have significant negative ramifications for growers and consumers alike.
The EWG’s “Shopper’s Guide to Pesticides in Produce” deters people from buying conventionally grown produce on the “Dirty Dozen” list, encouraging them to only purchase organic versions of these items. This annual guide also contains a “Clean Fifteen” list which includes produce items with the “lowest amounts of pesticide residues”. Neither list goes into detail regarding what these residues actually are, and whether they are even harmful to the consumer, and are therefore continually challenged by many scientists as lacking in scientific credibility.
Prior to 2025 EWG’s Dirty Dozen list was formulated primarily using percentages of samples with detectible pesticides and the number and amount of pesticides detected (with absolutely no information regarding the relative toxicity of these pesticides). As of this year, they have included the metric “overall toxicity of pesticides on a crop” as part of their screening criteria. Although this is a step in the right direction, it is still arguably incomplete information to share with consumers (especially since the most important component, whether these residue amounts are actually harmful to consumers, is still not addressed by any of their metrics, nor clearly communicated in their publications and marketing). This glaring omission is a big red flag in the credibility of this publication, and one of the main reasons why I have such a problem with it. As many of you avid Garden Professors Blog readers know from the many great science-based posts that have been shared (including Linda’s article on Recognizing Bad Science), we need to look carefully at the information being shared, regardless of the source, and make sure that it is evidence-based, credible, and complete.
Understanding Pesticide Safety
I want to caveat this section by stating that this is covering the science pertaining to pesticides and human health based on the research we have on this topic to date (which is subject to change as more evidence-based information comes to light). The scope of this Blog post does not cover environmental/ecological/economic/etc. impacts of pesticides in general nor the overarching impacts of various types of agriculture and food production systems (both of these are very complex topics which will require much more time and research to cover).
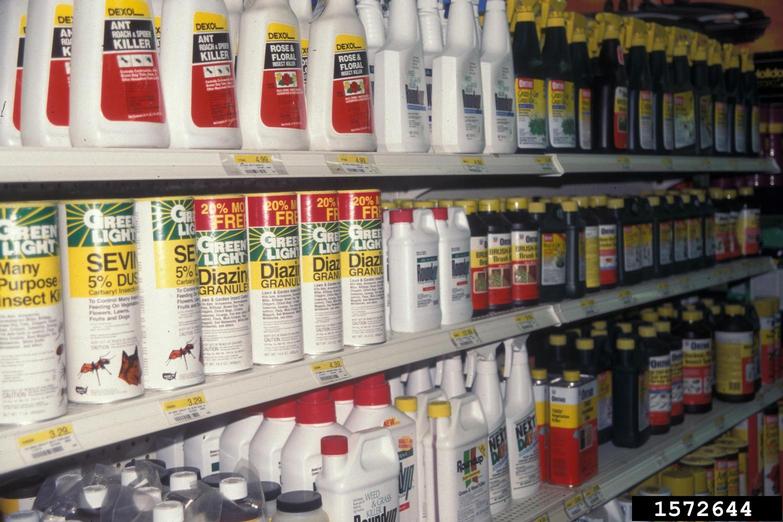
Although the term ‘pesticide’ is synonymously used with insecticides by many, pesticides are actually a broad category that includes all substances used to control or eliminate pests (including weeds, arthropods, vertebrate pests, pathogens, etc.). Therefore herbicides, insecticides, miticides, rodenticides, fungicides, bactericides, etc. all fall within the category of ‘pesticides’. Humans have been using ‘pesticides’ for thousands of years, though much of the innovation in pesticides (especially synthetic formulations) has occurred over the past 100 years. We have also greatly expanded our understanding and implementation of safety protocols and consideration for human and environmental health especially over the past 50 years (since Rachel Carson’s ‘Silent Spring’ and the formation of the U.S. Environmental Protection Agency (EPA) in 1970). Thankfully we have come a long way from the ‘DDT is good for ME-E-E’ era (and still have quite a long way to go). Although we are not perfect, pesticides in general are continuing to become safer and more effective, and products with higher toxicity and non-target effects are continually being phased out in support of better chemistries with fewer human health and environmental impacts (though the latter has much more knowledge gaps than the former, and we still have a LOT more work to do on this front). As we learn more about these products with scientific studies, we continue to update our protocols pertaining to them, though there are still knowledge gaps which continue to be explored by researchers. As Extension and IPM (Integrated Pest Management) professionals, we continue to educate people on the importance of pesticide safety, and urge people to think of the environmental impacts of these products, using them only after other IPM strategies (such as cultural, mechanical, and biological controls) have been unsuccessful. Anyone who uses pesticide products (whether Restricted Use Pesticides applied by Certified Pesticide Applicators and those under their direct supervision, or readily available general use pesticides such as Neem Oil, Insecticidal Soaps, etc.) should do so responsibly and in accordance with the label (the label is the LAW!), only when needed, and minimize negative environmental impacts when possible. The history of pesticides and formation of current regulatory protocols is a fascinating topic that I encourage all of you to read up on if you are interested (and may be an interesting topic for a Blog post in the future).
Now that we have covered pesticide basics, let’s get into pesticides and food safety in Organic and Conventional agriculture. First and foremost, if you are purchasing organic produce, that does not mean it is pesticide-free. In the United States, Certified Organic produce refers to food items that are grown utilizing a specific set of principles governed by the National Organic Program. Furthermore, there could be several conventional operations that still follow some of these principles, though may not be Certified Organic. An organic pesticide is basically a pesticide that is approved by the USDA for use in organic agriculture. Although pesticides used in organic agriculture are usually naturally derived, there are also synthetic pesticides that meet the criteria and are allowed in organic agriculture (just as there may be organic pesticides used in conventional agriculture). All pesticides utilized in the U.S. (with the exception of minimum risk pesticides) are registered with and regulated by the EPA. Any of the aforementioned pesticides that are used and sold within the U.S. have rigorous testing surrounding their safety for humans (and maximum allowable concentrations which are set at levels significantly below [10-1000 times lower] those that caused no adverse effects during testing), labeled according to these appropriate evidence-based safety guidelines, and off-label use is prohibited, routinely investigated, and enforced. Regardless of organic/conventional designation: just because something is naturally derived does not mean that it is safer than synthetically derived products. There are many natural substances that are extremely toxic (eg. Botulinum toxin, Ricin, Cyanide, Arsenic, Asbestos, etc.) and many synthetic ones that are relatively benign in comparison. In summary: Organic does not mean pesticide free, and natural/naturally derived does not mean safe.
For any of us that have taken a toxicology class, one of the most memorable take home messages was “The dose makes the poison”. Credited to a Swiss physician named Paracelsus in 1538, this statement applies to any chemicals (including water, salt, oxygen, caffeine, Aspirin, etc.) that are consumed or absorbed by us, forming the foundation of health and safety guidelines that determine the maximum allowable concentrations (tolerance levels) of these substances in our food, water, and the environment.
One of the most useful and illuminating courses I have ever taken in my career was Environmental Risk Assessment, which covered important topics including toxicology, pesticide risks, and invasive species (among other concepts). This course also detailed how Risk Assessments are conducted, the rigorous regulatory processes and evaluations required before products are even available for use, and the evidence-based tools used to determine whether a substance is hazardous and at what level (dose). A great summary of the Risk Analyses pertaining to pesticides and food safety have been summarized by Alejandro Fernández, Agronomist and Director of Hygiene and Safety of Products of Plant Origin SENASA (Argentine Food Safety and Quality Service), on the Pesticide Facts website (link in resources). These Risk Assessments and Analyses are the foundation of how we go about making determinations regarding any substances that we may be exposed to (including food and medicine).
The Issues with the ‘Dirty Dozen’
One of the biggest issues with the Dirty Dozen list is the fact that they do not communicate what having the highest (and lowest) pesticide residue levels even means. They do not conduct an accurate Risk Assessment to be able to support their message for avoiding conventional produce on this list. Although they do talk about the hazards (substances that have a potential to cause harm to us), they omit the crucial component of actual risk (likelihood of that substance causing harm to us), which incorporates another critical component of Risk Assessments: Exposure (how much of the hazard we are exposed to over a given period of time). If we looked at actual risk from the residues (incorporating hazard and exposure) we would find that the residues found on these produce items on the Dirty Dozen list are extremely low, and far below the threshold of having any risk associated with them, especially if we account for exposure (how many we consume on a daily basis, and over an extended period of time). A peer-reviewed Risk Assessment on pesticide residues published in the Journal of Toxicology by Winter and Katz (2011) in response to EWG’s 2010 Dirty Dozen list found just that (link in resources). Their conclusions were: (1) exposures to commonly detected pesticides in the 12 Dirty Dozen commodities had negligible risks for consumers, (2) substituting organic commodities for these conventionally grown ones did not result in any significant reduction of risk, (3) the EWG methodology for determining risk of these 12 products lacks scientific credibility (Winter and Katz, 2011).
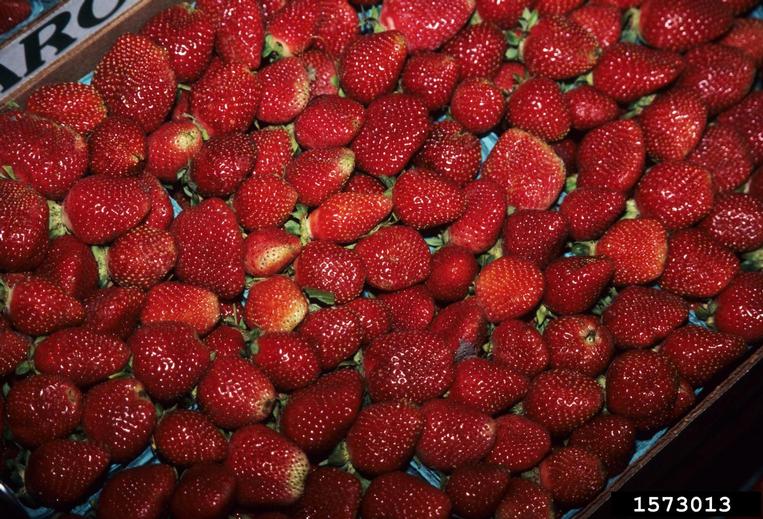
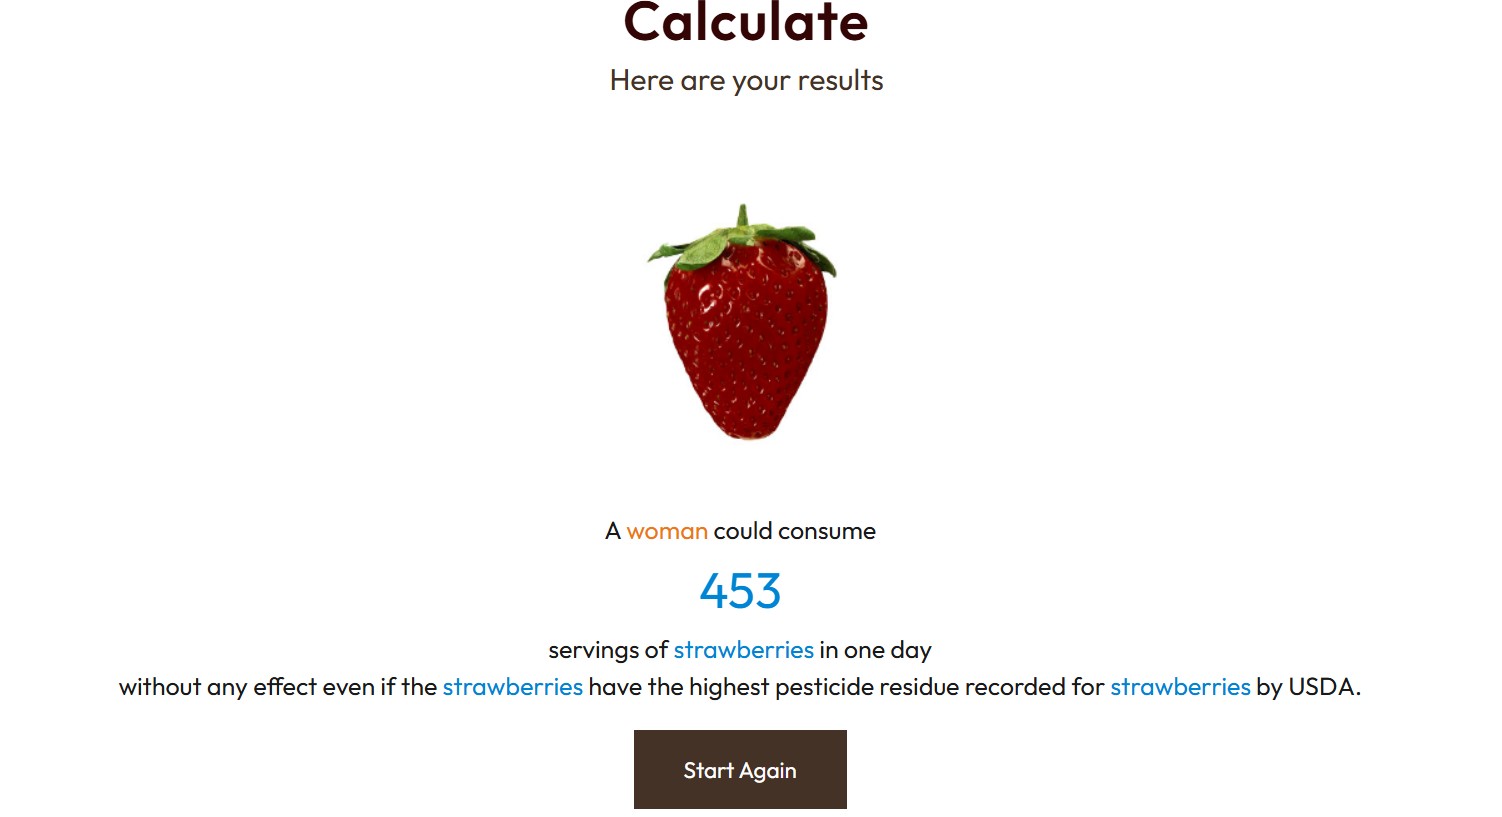
Based on this cool pesticide residue calculator (link in resources), a woman of average height and weight could consume 774 servings of spinach or 453 servings of strawberries (the #1 and #2 produce items on the Dirty Dozen list) in a day without any effects. This calculator utilizes the highest possible amount of pesticide residue recorded by the USDA in these produce items, and not the average amount. Now I don’t know about you, but I would personally struggle to consume even 10 cups of strawberries in a day (every day), let alone over 450 cups. This is a great illustration of how dose/risk works, and why these produce items are considered safe for human consumption in conventional agriculture.
In summary: the EWG fails to mention that these residue levels are still safe, and far below the thresholds that can begin to have an impact on the consumer. This can have negative ramifications for farmers that grow the produce on these lists, especially if they grow conventionally as opposed to organically. Concerns that people may opt to avoid conventionally grown produce, or avoid those specific produce items altogether is an added hurdle for growers to worry about. Both conventional and organic farmers care about what they produce, and also want our food to be safe (for their families and ours). Our regulatory processes further monitor this safety in both conventional and organic production systems, and as the science is updated, so are these processes. Although many lack access to this, if you have access: reach out to local growers and get to know what their practices are to get a better understanding, and support local farmers when possible.
Furthermore, marketing and messaging like EWG’s Dirty Dozen list discourages people from consuming certain produce, and with only 1 in 10 Americans eating enough fruits and vegetables in their diet, the cons far outweigh the pros for this messaging. An article from the Alliance of Food and Farming details some of these negative impacts (see Resources). This type of fear-mongering disproportionately impacts consumers in lower income brackets, and those that lack access to certain produce. A 2016 consumer survey showed 15% of lower income shoppers surveyed would opt to eat less fruits and vegetables after hearing about the ‘Dirty Dozen’ (Huang et al., 2016).
The take home message should be: the produce that you purchase, whether conventional or organic, is safe to be consumed (and backed by rigorous testing that determines this). Do not be deterred from eating the produce of your choice. Choose produce that is enjoyable, affordable, and accessible to you. And whether conventional, organic, or home-grown: eat more fruits and veggies!
Carl K. Winter and Josh M. Katz, 2011. Dietary exposure to pesticide residues from commodities alleged to contain the highest contamination levels. Journal of Toxicology, Article ID 589674, doi:10.1155/2011/589674. https://pmc.ncbi.nlm.nih.gov/articles/PMC3135239/