Heat domes, wet spells, and the weather patterns that tie them together

Do you have a favorite kind of weather that you love to experience? For me, it’s the first warm evening of spring, when the air is just warm enough and the wind just strong enough for the air to feel as though it is dripping off my fingers. On nights like that, I can tell that the air really is a fluid, the topic of this week’s blog.

The wind of spring, Toshihiro Oimatsu via Commons Wikimedia

What causes atmospheric weather patterns?

You may have noticed this year that the weather patterns across both the United States and Europe have been very persistent. That has led to the occurrence of record-setting high temperatures in some locations like the Pacific Northwest and the central US and southern Europe as well as day after day of rain in the Southeastern US. Both of these weather patterns have caused no end of grief for gardeners and farmers, since weather is seldom stuck on day after day of “perfect” conditions (even if you could define what those are).

To understand how weather patterns get stuck, it helps to know how the air moves through the atmosphere. Wind is driven by differences in heating between two areas. That contrast leads to differences in density and pressure between the areas, and the air flows from higher pressure to lower pressure to try to equalize the amount of air between those areas. The large-scale weather patterns across the globe are caused by differences in the sun heating the spherical earth at the equator and at the poles at different angles due to latitude. There are also smaller-scale wind circulations due to differences in heating between land and water (oceans or lakes) that cause the same movement of air molecules. The earth is not uniform, with continents in some areas and oceans in others and has mountain ranges that also divert the flow of air. The earth is also rotating, and that makes the wind appear to be turning towards the right in the Northern Hemisphere (left in the Southern Hemisphere), which we call the “Coriolis force.” Friction can also slow down the wind and cause it to change direction near the earth’s surface, which adds to the calculation.
Atmospheric waves

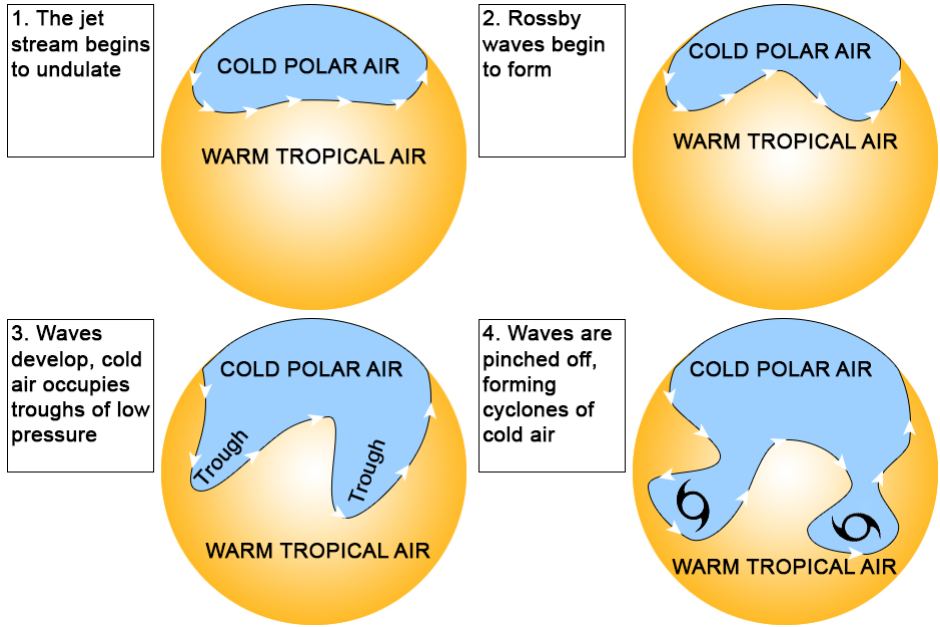
The net result of all these forces acting on the air are a series of atmospheric waves of high and low pressure around the earth that control where the weather goes (these are known as Rossby waves after the great meteorologist Carl-Gustav Rossby). A great website to view these waves is at https://earth.nullschool.net/, with a dynamic view of the air flowing around the earth. You can move the earth around with your mouse by clicking and dragging it, and you can change the size by pinching and dragging on your touchscreen if you don’t have a mouse with a wheel. If you click on “earth” on the bottom left of their map, it pulls up a menu that allows you to pick different heights in the atmosphere (1000 mb is closest to the surface, 500 mb is about halfway up in the atmosphere, and 250 mb (shown in this figure from July 29, 2021) is roughly the height that jets fly.

The image shows areas of strong winds (in red) and weak winds (in blue). The strong winds at 250 mb are called “jet streams”, and they push weather systems around. The strong jet stream over the upper Great Lakes in this image helps explain why the severe weather that moved through Wisconsin on July 29 moved from northwest to southeast. The jet streams outline the atmospheric waves that control the large-scale weather patterns. In the Northern Hemisphere, winds blow clockwise around areas of high pressure (“ridges”) and counterclockwise around low pressure (“troughs”). It is much easier to see on the website than on this static image, although traditional weather maps usually show the wind direction using arrows to help. As the image shows, often a ridge in one half of the continent is accompanied by a trough in the other half just like an ocean wave.

The large-scale weather patterns that are connected to atmospheric waves are constantly shifting as the air in the atmosphere tries to balance out all the forces that are pushing it around. (This 30-second video shows how the waves typically evolve over time.) Often the waves move, usually from west to east in the mid-latitudes, and so the weather at those latitudes also tends to move from west to east. But sometimes the weather patterns get stuck in one spot, and cause day after day of the same weather. We call these “blocking” patterns because they block the natural movement of the waves, locking the weather pattern in place for long periods. That is what we have seen this summer, with a very strong high-pressure center locked over the western U. S. and a trough of low pressure draped over the eastern U. S. for much of the last few months. In summer, high pressure usually causes sinking air, lack of clouds, warm temperatures, light winds, and no rain. In contrast, low pressure leads to rising air that forms clouds and rain and cooler temperatures due to the clouds.

What is happening this summer?

The blocking this summer has been more persistent than usual, with strong high pressure in the west causing a very hot and dry area to form (sometimes called a “heat dome”). Once you get a strong high like that to form, it can get anchored in place by the dry conditions and high temperatures at the surface, making it very hard to move. The length of time that this summer’s high has lasted has contributed to the string of record-setting temperatures and lack of rain and subsequent drought that region has experienced this year. By contrast, in the Southeast, low pressure has led to a stubborn low-pressure trough that has brought rain to the region almost every day, preventing farmers from doing field work or drying hay and increasing the occurrence of fungal diseases on their crops. If you know you are in a blocking pattern, that means you should prepare to experience the same weather for protracted periods of time and adjust your gardening schedule to accommodate the weather you are likely to see for the next week.

River meander, outside of Kobuk Valley National Park, National Park Service

How will atmospheric patterns change in the future?

Some but not all atmospheric scientists think that as the earth gets warmer, the temperature difference between the equator and the poles will decrease and that this will lead to atmospheric wave patterns that are loopier, like winding rivers in an almost flat coastal plain. This could lead to both more extreme weather and potentially, more frequent blocking patterns. Gardeners need to prepare by designing their gardens to handle both more extremes of weather, including heat waves and floods, and periods of more persistent weather, which could lead to more frequent and longer droughts. That means making sure that you need to have good drainage for high-intensity rainfall events but also need to use methods like mulching with arborist chips to preserve the moisture in the soil for those times when no rain is in the forecast for extended periods.
Backyard biocontrol – using natural enemies to wipe out invasive weeds

The agricultural-residential interface

Four years ago we moved to the family farm (where I grew up) and we’ve enjoyed restoring the 1 acre landscape around the farmhouse. Given that the residential part of this farm is surrounded by pastureland, there is a continual influx of weed seeds into our managed beds. While our thick applications of arborist wood chips have kept out many weeds, they still pop up where mulch hasn’t been applied yet or is too thin.

Photosensitized livestock will suffer severe sunburning after consuming Hypericum perforatum

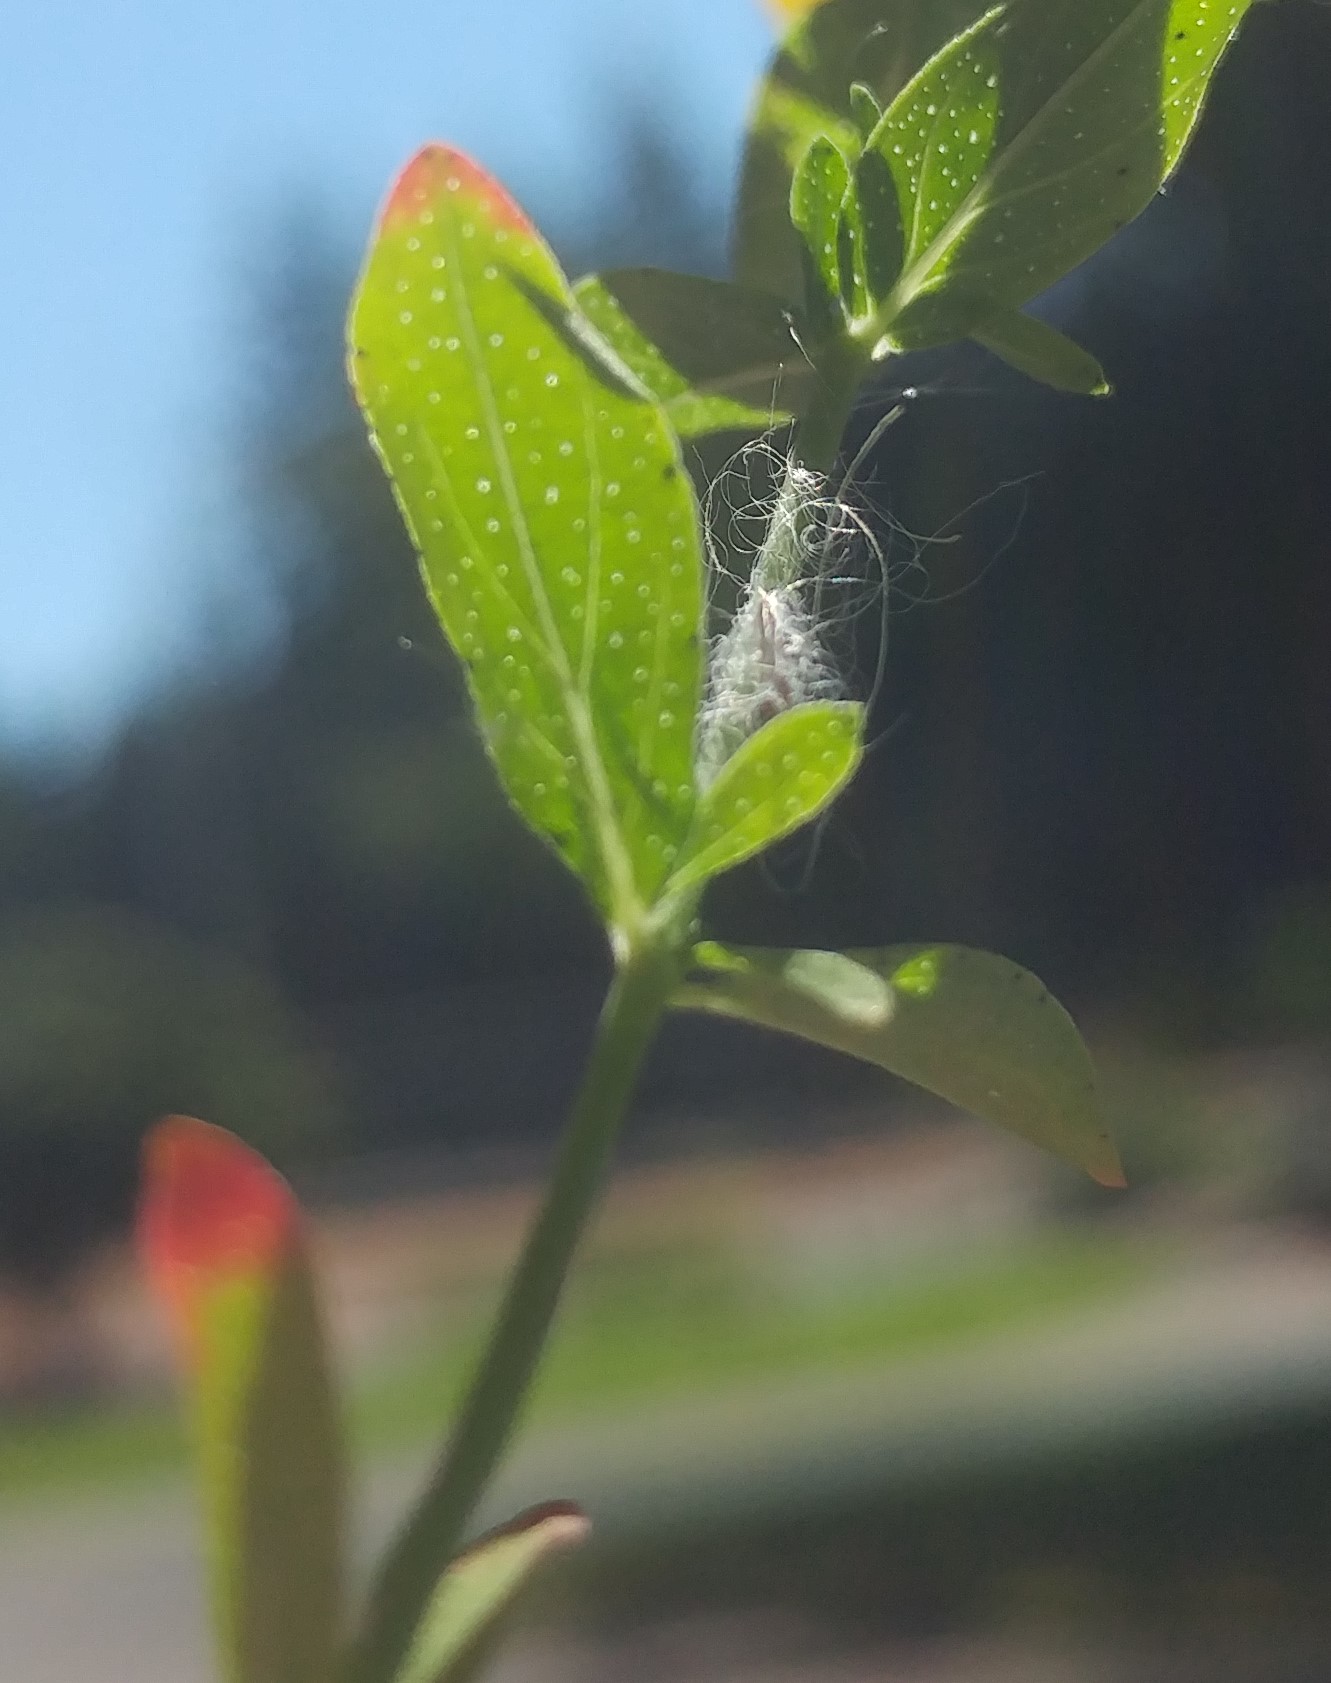
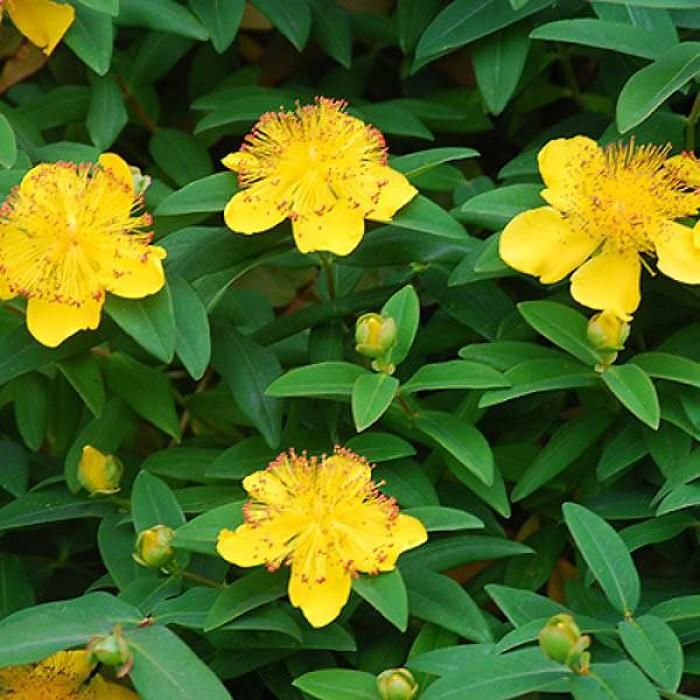
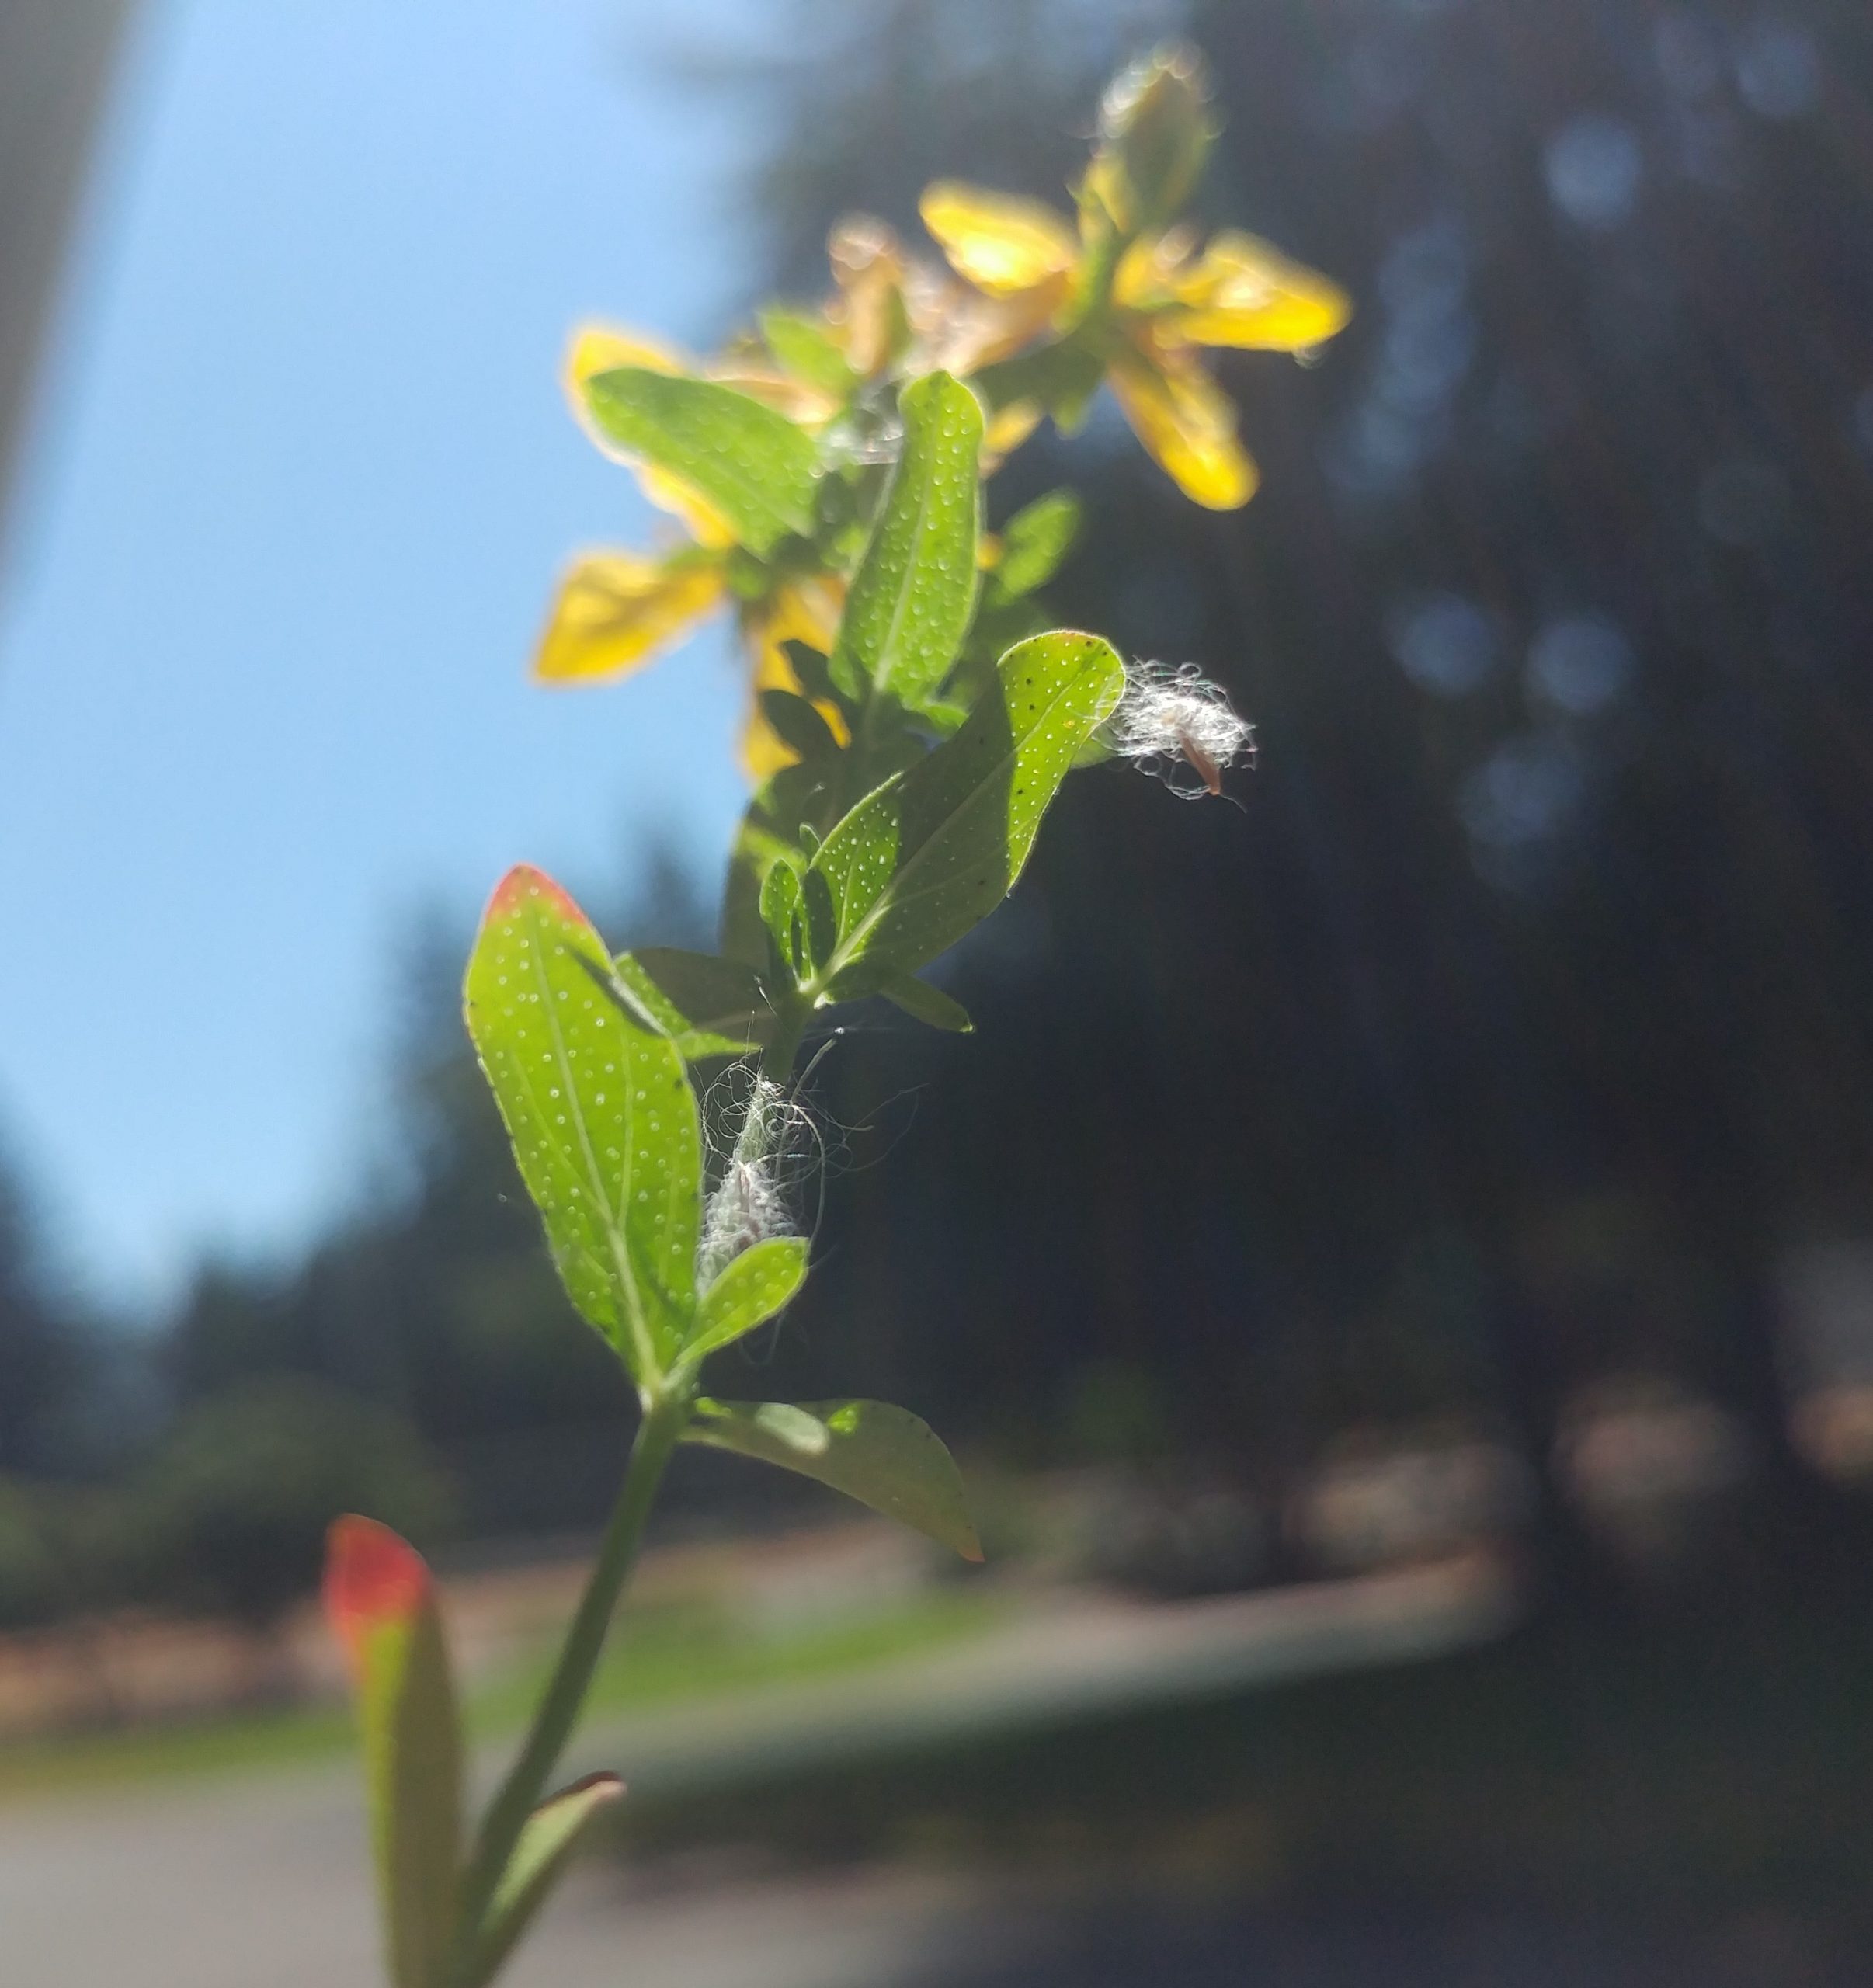
One of these weeds is Hypericum perforatum (also known as Klamath weed or St. John’s wort), a species native to Eurasia. The latter common name can confuse gardeners, as there are several ornamental species of Hypericum also called St. John’s wort, but H. perforatum is easily identified by the perforations in the leaf. This invasive species is a problem for our cattle, as Klamath weed causes photosensitivity when it’s consumed and can be toxic in large amounts.

The weeds to the right of my raised beds include St. John’s wort, or Hypericum perforatum.

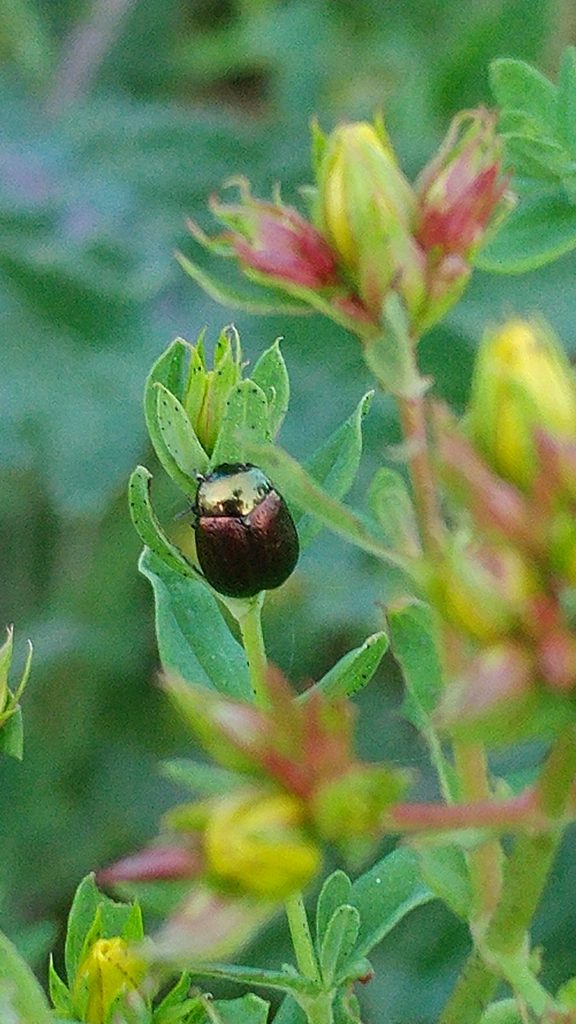
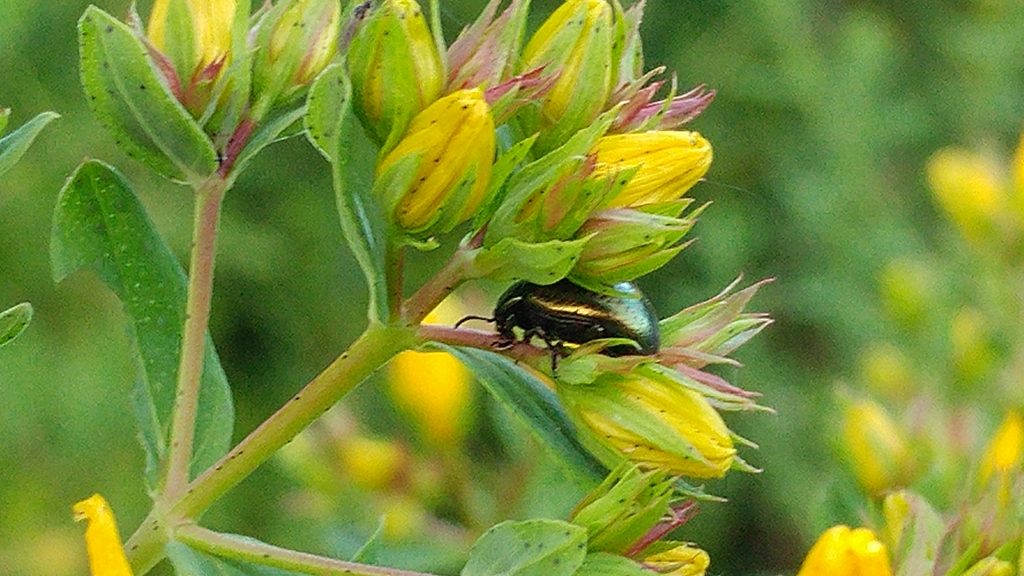
In the last few years H. perforatum colonized our stockpile of native soil waiting to be used in our raised beds. It was a small enough infestation that we could pull it all up, but a closer look revealed that some shiny metallic beetles were already busy feasting on the leaves. Putting on my IPM hat, I first needed to identify these interesting beetles. It didn’t take long to find out they were a Chrysolina species.

Chrysolina hyperici and C. quadrigemina (or St. John’s wort beetles) are also native to Eurasia and are specialist feeders – they only feed on Hypericum species. They were imported as biological control agents several decades ago and have been effective in controlling dense populations of St. John’s wort. C. quadrigemina in particular has been reported to feed on both ornamental and native species of Hypericum but not to the extent of causing significant damage.

Both species of the St. John’s wort beetle feed on the leaves, where they also lay thousands of eggs. The larvae that emerge from the eggs are voracious feeders and can defoliate dense stands of St. John’s wort. Like other animals that eat Hypericum perforatum, the larvae become photosensitive and generally feed before sunrise to avoid damage.

Hypericum perforatum infestation

Since biological control agents depend on the presence of their host, it’s important to retain a small population of the host. And because this particular beetle is a leaf feeder, one can remove the flowers of the plants to reduce reproduction, but maintain the plants to support the beetle.

Cinnabar moth (Tyria jacobaeae) was introduced to the US to help control tansy ragwort (Jacobaea vulgaris), another invasive, noxious weed

Many other introduced, invasive weeds can be controlled using carefully researched microbes and insects. Some of these biocontrol agents may already be found in your area – so it’s important to avoid using insecticides and fungicides, in particular, to conserve these garden assets.

Water: Garden Friend….and Foe? – Water, Relative Humidity, and Plant Diseases

We all know that water is essential for life and that we have to ensure our landscapes, gardens, and houseplants all have a sufficient supply of the stuff.  Forget to water your garden during a hot, dry spell and it could mean disaster for your plants.  But water can also create issues for plants, usually when it is in an overabundance – water helps spread and develop diseases on foliage and excess soil moisture can damage roots, creating opportunities for root rots and other diseases.  How do you meet the water needs of the plant while also avoiding issues associated water?  Understanding how water affects disease organisms will help, along with some tried and true Integrated Pest Management Strategies.

Water and Pathogenic Microbes

Both bacteria and fungi require water to grow and reproduce.  Most do not have a mechanism to actively take up and manage water, so they uptake water mainly through osmosis.  This means there must be some form of water present for those microbes that are actively growing and especially for processes like reproduction which use not only a lot of energy but might also be required to carry spores in order to spread.

File:Septoria lycopersici malagutii leaf spot on tomato leaf.jpg -  Wikimedia Commons
Septoria leaf spot, a common fungal disease of tomato that requires water for initiation and development.

Both pathogenic microbes and beneficial (or neutral) microbes require water to thrive.  It is one side of what we refer to as the disease triangle.  Water (along with temperature) are major components of the “favorable environment” side of the triangle, with the other sides being a plant capable of being infected and a population of pathogens capable of infecting.  Those last two sides meaning you have to have a population of the pathogen big enough to initiate or sustain an infection and a plant that can actually be infected by that pathogen.  For example – one disease spore may or may not be enough to start an infection (depending on the pathogen), but several hundreds or thousands definitely can.  And the pathogen has to be one that can actually infect the plant – it doesn’t matter if you have a million spores of Alternaria solani (one of two closely related fungi that cause early blight in tomatoes) on your cucumber plants, they likely won’t get a disease.  But if there are spores of A. cucumerina, a different species, you’ll likely get leaf spot on those cucumbers.  But it doesn’t matter if you have both a susceptible plant and a pathogen, there has to be a favorable environment (water and temperature) for there to be a disease infection. 

As this paper points out, water in the form of liquid (rain, ground water, dew, etc) and vapor (air humidity, fog) can provide the environment for microbe development in the soil and on foliage.  Microbes in the soil are ubiquitous as water is typically available in most soils (except in droughty or arid areas) , but excess soil moisture can create booms in populations for both the “good” microbes and the “bad” ones.  Microbes that live on foliage (sometimes referred to as epiphytic since they rely on moisture from the atmosphere) are much more likely to be water stressed since they are exposed to the atmosphere.  When there isn’t water available on the surface of leaves (from rain, fog, etc.) microbes tend to colonize around areas where water leaves the plant – stomata and to a lesser extent around tricomes and hairs. 

The paper also points out high atmospheric humidity is positively correlated with the number of fungi on a leaf surface. It’s also a requirement for diseases microbe spores to germinate, for filamentous fungi to break dormancy, for pathogen survival, for microbe movement on the leaf surface, and for disease infections to be sustained.  It is also shown that heavy precipitation increases water availability to these microbes thus hastening their growth.  Precipitation also dislodges and disperses pathogen spores and cells to adjacent plant tissues, and to leaves of nearby plants.  High humidity also makes leaf cuticles more permeable and promotes opening of the stomata, which can serve as an entry point for pathogenic infection.

Once inside the plant, microbes such as fungi and bacteria can thrive on the aqueous environment inside a plant, moving easily between cells or into the vascular tissue (depending on disease).  Pathogens that thrive in wet conditions, however, may initiate water soaked lesions on the plant to develop conditions favorable to their growth. 

Water, water everywhere – so is there anything you can do?

Of course, water is naturally occurring and in most places falls from the sky in some form or another.  In some places very little precipitation falls, in others there’s a lot. And don’t forget about the humidity, dew, and fog (which are often more common in places that get more rain, but provide moisture even in dry climates).  There are a few places where the atmospheric moisture levels are in that “just right” zone to support plant growth but not pathogen growth, which makes agricultural production of certain crops easier.  You could consider these areas the “Goldilocks” zone for crop production.  For example, a lot of seed crops are produced in the Midwest and arid north West, potatoes in Idaho, apples in Washington, etc.  The conditions there mean that, at least when those crops were getting established (before the advent of modern pesticides) in those regions, disease pressure was low. 

You can’t stop the rain, of course, if you’re in a place both blessed and cursed with abundant rainfall or atmospheric humidity.  But there are some things that you can do reduce the likelihood of diseases spread or supported by that water and humidity.

  • Evidence shows that there is a positive correlation between the density of planting and disease incidence.  Therefore, proper plant spacing and pruning can do at least three major things.  First, having space between plants, especially in the vegetable garden, can reduce the splashing of pathogens from one plant to the next during a precipitation event.  Second, it increases air flow through the plant, which can reduce the likelihood of pathogen spores that might float in and land on foliage.  Third, it reduces humidity in the immediate microclimate around the plant. The increased air flow in addition to the reduced amount of foliage that is releasing water through transpiration can have a significant effect on the humidity, which can have a big effect on the germination, establishment, and survival.  
  • Utilize diverse planting plans in the vegetable garden and the landscape.  Research shows that while having a variety of plants increases the diversity of disease organisms, it actually reduces the infection rate possibly because pathogens splashing from plant to plant are less likely to find a host plant if they are surrounded by non-host plants.  This practice is promoted in intensive vegetable plantings such as square foot gardening. 
  • As stated earlier, precipitation can drastically increase the population of microbes on foliage.  This also includes water from overhead irrigation.  For example, this study found that overhead watering of cabbage led to significantly higher and faster rates of spread of the black rot fungus as compared to drip irrigation.  Therefore, reducing or avoiding overhead watering can reduce the likelihood of disease incidence. 
  • Timing of watering may also contribute to disease development.  The dew point, which usually happens during the night time hours, is when the air is totally saturated at 100% relative humidity and therefore cannot hold any more water.  This is the point where excess moisture is deposited as dew on surfaces (another source of water on the foliage) and little to no evaporation of water already on surfaces happens (learn more at weather.gov).  As shared in this book chapter review, lower temperatures resulting in reaching the dew point can extend the time leaves are exposed to high moisture and result in higher disease incidence. 
  • As our own GP Linda Chalker-Scott points out in this review, mulching not only retains soil moisture, reduces erosion and more but also reduces the incidence of disease in plants by reducing the splashing of soil or spores from rain or irrigation onto the plant.  This drastically reduces disease spread from pathogens found in the soil or on plant debris.  The organic matter from organic mulches also has the benefit of increasing the population of beneficial microbes, which out-compete the pathogenic microbes. 
Mulching and drip irrigation can both significantly reduce disease incidence in gardens.
  • Crop rotation, where crops are not grown in the same soil or plot for a number of years, also reduces disease incidence by reducing pathogen loads in the soil or from crop residues left in the garden.  This study shows significantly reduced disease incidence on potato and onion when a crop rotation plan of four years is utilized (meaning that either onions or potatoes are not planted in the plot for a minimum of four years, with other crops planted between those years). 
  • If root rots and pathogens are a problem, try improving drainage around the garden. Adding organic matter can help with water permeability of the soil over time. Raised beds can also drain faster than in-ground gardens.
  • Of course, if you’re having lots of problems with certain diseases on your plants, these cultural controls may not be enough.  Finding resistant varieties may be a necessary step in breaking the disease cycle in your garden.

Overview

While water is required for plant growth, it can cause issues with plant diseases if there is too much or if it lingers on the wrong parts of the plant for too long.  Water from rainfall, irrigation, high humidity, fog, and dew can all lead to the initiation, development, and longevity of plant fungal or bacterial diseases.  Reducing the amount, persistence of water or humidity on or around foliage can significantly reduce the likelihood of plant disease incidence.  Methods such as reducing overhead irrigation, timing of irrigation, mulching, and crop rotation are key cultural methods in reducing diseases spread by water. 

Sources:

Aung, K., Jiang, Y., & He, S. Y. (2018). The role of water in plant–microbe interactions. The Plant Journal, 93(4), 771-780.

Burdon, J., & Chilvers, G. A. (1982). Host density as a factor in plant disease ecology. Annual review of phytopathology, 20(1), 143-166.

Café-Filho, A. C., Lopes, C. A., & Rossato, M. (2019). Management of plant disease epidemics with irrigation practices. Irrigation in Agroecosystems, 123.

Chalker-Scott, L. (2007). Impact of mulches on landscape plants and the environment—a review. Journal of Environmental Horticulture25(4), 239-249.

Krauthausen, H. J., Laun, N., & Wohanka, W. (2011). Methods to reduce the spread of the black rot pathogen, Xanthomonas campestris pv. campestris, in brassica transplants. Journal of Plant Diseases and Protection, 118(1), 7-16.

Rottstock, T., Joshi, J., Kummer, V., & Fischer, M. (2014). Higher plant diversity promotes higher diversity of fungal pathogens, while it decreases pathogen infection per plant. Ecology95(7), 1907-1917.

Wright, P. J., Falloon, R. E., & Hedderley, D. (2017). A long-term vegetable crop rotation study to determine effects on soil microbial communities and soilborne diseases of potato and onion. New Zealand Journal of Crop and Horticultural Science, 45(1), 29-54.

Diagnosing Abiotic Disorders I

Abiotic factors cause harm to plants resulting in symptoms. Abiotic disorders can look like damage caused by pests but do not spread in the same ways since the disease agent is not alive.

Insects and pathogens cause damage and disease in garden plants, but damage can also occur in absence of pests. We refer to these diseases as abiotic disorders. Plant pathologists consider abiotic disorders diseases because plants develop symptoms that reflect the changes in their physiology over time. Unlike outbreaks caused by insects or pathogens, abiotic disorders do not cause epidemics or as plant pathologists say “epiphytotics” because abiotic disorders do not spread the way insects and pathogens can. Like all diseases, abiotic disorders are a perturbation of plant physiology that show up as different or “not normal” appearance. Symptoms typically define most abiotic disorders since signs (of the actual thing causing the disorder) are not usually visible.

Since abiotic disorders do not require an organism to begin or complete a life history, they can occur at any time and are often of sudden onset. The reverse can also be true, depending on the agent causing disease symptoms which may not show for years in some disorders. Abiotic disorders are often associated with the degree to which a plant is adapted to its environment. Adaptation and establishment in an environment are different. New plantings  (those not yet established) do not tolerate abiotic extremes as well as established plants. Plants poorly adapted to the climate, soils or water of a region may be prone to abiotic conditions while plants adapted to their planting site thrive among the same abiotic factors.

Nutrient Disorders

Interveinal chlorosis is a symptom of nutrient deficiency. When on new leaves it usual is a micronutrient deficiency on older leaves a number of mineral deficiencies can result in chlorosis

Plants require mineral nutrients (which arrive in the sap flow after intake by roots) from soil solutions. While carbon, hydrogen and oxygen come from air and water, virtually all the other elements plants need for their growth and physiology come through the root system. Minerals are dissolved in water as ions and are available at various pH levels depending on their solubility characteristics. In general, under alkaline conditions many minerals are held in soil as insoluble precipitates and are unavailable; under acid soil conditions some elements again become insoluble and many leach away from the root zone causing soils to become depleted, especially of metals. Since roots take up minerals as ions (charged molecules) roots must be alive to regulate osmotic potential and the charge balance of ions entering and leaving roots. Anything that compromises root function can lead to inability to take up nutrients and eventually symptoms of nutrient deficiency. Compaction, flooding, root injury, poor soil food web conditions, and pathogens can all impair root function. Plants can show nutrient deficiencies for the following reasons:
• The minerals are missing from the soil
• The pH is not favorable for absorption of the nutrient which is insoluble
• The roots are not able to function and absorb nutrients
• Lack of mycorrhizae in soil or poor conditions for microbial growth

A soils diagnostic lab can help identify soil conditions and nutrient content of your samples, and suggest methods to provide optimum plant nutrition. Several soil samples should be taken all through the areas where affected plants grow, combined and sent to the lab soon after collection. Soil pH is like blood pressure – you can’t tell when it is too high or too low – so you need to have it tested. Knowing the soil reaction (pH) is the first step in investigating nutrient issues. Mulched plantings (with coarse tree trimmings chips) usually have few deficiencies in a wide range of soil conditions because nutrients are slowly but constantly provided and beneficial microbes can assist roots in nutrient uptake.

Temperature Extremes

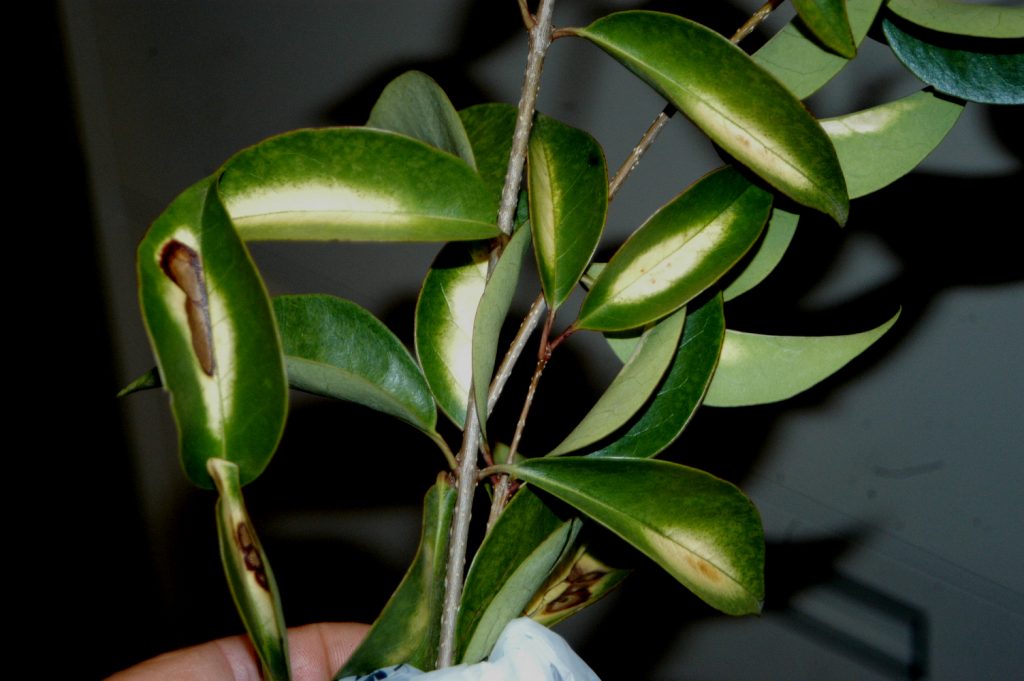
High light intensity can damage any part of a plant if it is not acclimated to the radiation or if it is undergoing water stress. Here leaves of Privet were damaged by high heat levels
Temperatures that exceed native plant adaptations happened in 2012 and 2020 in California causing extensive damage to native oaks.

Temperature extremes cause injury and may cause abiotic disease to landscape trees. As the climate continues to warm, extreme hot weather is increasingly likely. In California, we had record all time high temperatures in the last three consecutive years and this year in the Pacific Northwest.   In some cases these temperatures were damaging to native tree species, suggesting that they are no longer adapted to the new normal temperature extremes. Years of record breaking freezing temperatures have declined, although cold temperatures can harm sensitive species if freezing occurs suddenly or for prolonged periods. Sunburn comes when temperatures exceed the ability of bark and leaves to adequately cool the tissue. Burned leaves fall from the tree and bark often splits, cracks and dies. This damage can become an important entry point for fungal pathogens such as Botryosphaeria spp. that cause canker diseases in most landscape trees. Planning for a warmer climate means selecting trees that can tolerate higher peak temperatures in summer while surviving the low temperatures of winter.

Air pollutants

Ozone causes “flecking” on pine needles. Image from Petr Kapitola

Another air pollutant is sulfur dioxide, which reacts in the atmosphere to form sulfuric acid,  and may reduce the pH of surface waters.  Acid deposition due to SO2 (the precursor) is an eastern US problem and often tied to coal use for electrical generation.  Air pollution damage to plants depends on the specific air pollutant, its concentration, and the sensitivity of the plant species, with ozone the air pollutant in California having the greatest effect on plants.


Air pollutants originate from a variety of both natural and anthropogenic sources.  Some, called primary pollutants, are released directly into the atmosphere.  Others, called secondary pollutants, are formed via atmospheric reactions of precursors.  Some air pollutants are both primary and secondary.  Ozone is a principal air pollutant in California which also affects plants. It is formed in the lower atmosphere when volatile organic compounds (VOC), i.e., short-chain carbon-containing compounds, which are released from a variety of anthropogenic as well as natural sources, react in the presence of sunlight with oxides of nitrogen (NOx) which come from internal combustion engines.

Ozone is toxic to plant cells because it is very reactive and quickly binds to plant tissues causing damage. Note that ozone in the stratosphere is necessary and protective of life.  It is the same molecule but has a different chemistry of formation. In urban areas, such as the Los Angeles Basin, pollutants may be held in the lower atmosphere by topography and meteorology, and ozone levels  may exceed federal standards for air quality, although much progress has been made since the 1960s . Conifers are particularly sensitive to ozone. Needle retention is reduced and the trees thin and appear yellowed.

While all plant tissues are susceptible to abiotic disorders, stems are most resistant, while leaves, shoots and young roots are perhaps most at risk of environmental factors that cause these disorders. Like biotic diseases, plants with abiotic disorders may require time to develop symptoms. There is a progression from slight to severe symptoms depending on the intensity and duration of the environmental factor causing the disorder. Below are some of the most common causes of abiotic disorders.

References

Costello, L., Perry, EJ, Matheny, NP, Henry, MJ, and PM Geisel. 2003. Abiotic Disorders of landscape plants a diagnostic guide. ANR publication 3420 University of California, Communication Services, Oakland CA.

Manion, P. 1981. Tree Disease Concepts. Prentice-Hall Inc., 399pp.

Schumann, G.L. and C.J. D’Arcy. 2010. Essential Plant pathology. 2nd ed. APS Press The American Phytopathological Society. St. Paul, MN. 369pp

“PoP” Goes the Weasel

How do you plan your work in your garden? One of the things that is most likely to affect what you do is rainfall. But how do you know when and how much rain is likely to fall? One way to get an idea of the possibility of rain is to look at something called “Probability of Precipitation”, or as we call it, “PoP”. How often have you heard someone say that the weatherman (or woman) was wrong because they predicted 30 percent chance of rain and they did not get anything? Or someone else says there was only a 10 percent chance of rain and they got flooded? If you understand how these forecasts are made, it might help you plan your outdoor activities, including your garden work and when you water.

Source: John Robert McPherson, Creative Commons

How is “PoP” defined?

According to the National Weather Service (NWS):

PoP = C x A where “C” = the confidence that precipitation will occur somewhere in the forecast area, and where “A” = the percent of the area that will receive measurable precipitation, if it occurs at all. The forecast is what we call a “conditional” forecast—that means it depends on two different things, one of which requires the other to occur. It’s important to keep in mind that these forecasts are made for a particular period of time (often 12 hours) and for a particular area (the forecast zone). The first part of the calculation is whether or not it will rain at all anywhere in the forecast zone during the time that the forecast covers. The second is how much of the forecast zone will be hit by precipitation sometime during the forecast period.

How likely is it that precipitation will occur?

The first part of the equation above, “C”, is whether rain will occur or not in the forecast zone during the forecast period. Sometimes that is easy to determine if a big high-pressure center is over the area and no rain is expected anywhere in the region. That means that the first part of the equation is zero, and so the PoP forecast would be zero. If a strong front is moving through your area or a tropical storm is headed your way, the probability of rain somewhere in the area is probably close to 100%. But often, the likelihood of rain is not so clear. What if you are not sure about the timing of the front or the tropical storm? If it moves slower than expected, it might not make it to the forecast area before the clock ends for that forecast period. Or if you are not sure the conditions are going to be right for a rain shower to occur, then you might or not get precipitation, depending on the actual conditions. Then C becomes something between 0 percent and 100 percent, depending on how much you trust the computer models that produce the forecasts.


NWS radar image for June 26, 2021, at 4:28 pm ET. The arrow shows the direction of motion of the storms.

How much area will be covered by the storms if it does rain?

As I am writing this, it is raining at my house just southeast of Athens, GA (you can see the tiny yellow splotch on the radar map above). Sometimes it is clear that rain will cover the entire forecast area during the forecast period. But most of the time, we think it will rain in parts of the forecast area, but it will be “hit or miss” rainfall from discrete storms, not widespread coverage. The second part of the equation, A, is the forecaster’s estimate of how much of the area will be hit by rain sometime during the forecast period. It’s not as easy as you think, because those storms are moving, and they cover more of the region than you might expect. In my research I have found that often the PoP forecast is too low, and that rain as estimated by radar covers a wider area than you might expect based on the forecast. Fortunately, the NWS does provide radar estimates of precipitation that are calibrated by actual ground-truth rainfall data. The map below shows the 24-hour rainfall ending on the morning of June 27, 2021, including the rain you see in the maps above. For my CoCoRaHS rain gauge, the 0.05 inches I got correspond quite well to the light blue on the map.

24-hour rainfall estimated by radar June 27, 2021 at 8 am ET

Where do you get PoP forecasts?

So where do you get PoP forecasts and how do you use them? Most meteorologists provide PoP forecasts on their broadcasts or written forecasts. I tend to use the similar Precipitation Potential from the NWS hourly forecasts because they go six days out, which allows a longer planning horizon. You can see a simplified example of a forecast graph below. The “Rain” categories of Slight Chance, Chance, Likely, and Occasional correspond to Precipitation Potentials of roughly 5-25%, 25-50%, 50-75%, and 75-100%. The amount of rain in inches is shown superimposed on the bars, so you get an estimate of how wet it will be in that time period. You can find instructions for how to get your own hourly forecasts at my blog.

The hourly graph allows me to plan well ahead of whatever outdoor activity I am doing. The forecasts show hour by hour how likely precipitation is, including the chance of thunderstorms, and an estimate of how much rain will occur. Keep in mind that the forecasts six days out are not likely to be as accurate as the ones for tomorrow, but they are still useful for planning purposes. Using this information tells me when and how much rain to expect.

Example of an hourly weather forecast for Tifton, GA, on July 5 and 6, 2021. Other variables like wind and humidity are available but are removed here for simplicity.

How do you use PoP forecasts in your planning?

These forecasts are especially useful for determining when to irrigate or apply insecticides or fertilizers that require specific wet or dry conditions to work properly. If you can see rain will be starting soon, you might choose not to water your garden unless the rain amounts are likely to be small or the chance low. Or maybe you want to mow your lawn now before it gets wet. If you are planning to fertilize and if it needs to be watered in, now might be a great time! If you need to apply a treatment that requires wet leaves to be effective, then you might wait until after the rain is over rather than applying now and seeing the chemical wash away in the storm. These precipitation forecasts can help you make the best use of your time by providing targeted, timely information on when rain will occur and how much is likely to fall when it does.

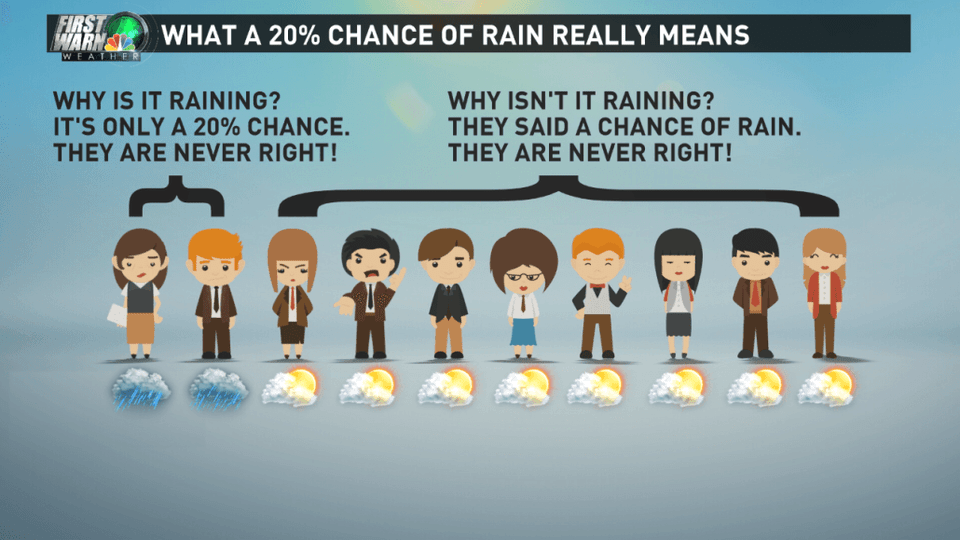
Figure courtesy of WCNC and Meteorologist Brad Panovich (@WxBrad on Twitter)

For more information on PoP forecasts, check out ” Do You (Or Your Meteorologist) Understand What 40% Chance of Rain Means?” by Dr. Marshall Shepherd, my colleague at the University of Georgia.