Planting Prognostication: Understanding last frost and planting dates

Except for areas of the US that are more tropical like southern Florida or Hawai’i, most gardener’s planting schedules are set around winter weather and the possibility of frost or freeze.  And even for gardeners in those more tropical areas, planting sometimes needs to be planned to schedule around the extreme heat of summer.  Understanding these planting times can really lead to success or failure, especially for vegetable gardens, tender annuals, tropicals, and non-dormant perennials.  There are a few tools that help us understand weather patterns and predict critical temperatures for planting, namely the USDA Hardiness Zone map and the Average Last Frost/Freeze dates.  The USDA Hardiness Map shares data on what the average coldest temperature is, which is key for selecting perennial plants that you want to survive the winter.  However, to know when to plant we look at the average freeze and frost dates.  There seems to be a little bit of mystery, and even confusion, around the dates and how to interpret them, so let’s take a little time to understand them a little better.  And since my background is in vegetable production, I’ll share a bit more detail there in terms of plants – but you can translate the information to ornamentals, especially those that are frost tender pretty easily. 

Understanding Average Last Frost Date

What is the average last frost date and how is it figured?  The average last frost date is exactly what it says it is – the average date at which the probability of frost has diminished.  Just how diminished really depends on the source, so we’ll follow up with that in a bit.  The data is computed by NOAA (National Oceanographic and Atmospheric Administration) and the National Weather Service to determine the probability of temperatures relating to frost and freezes based on weather data for an area over the last 30 years.  They compute the likelihood of a light frost (36 F), frost/heavy frost (32 F), or freeze (28 F) at three different probability levels – 90% (the temperature is very likely to happen), 50% (the possibility is 50/50), or 10% (the temperature is unlikely).  This tool from NOAA provides a chart with probabilities for locations throughout each state.  

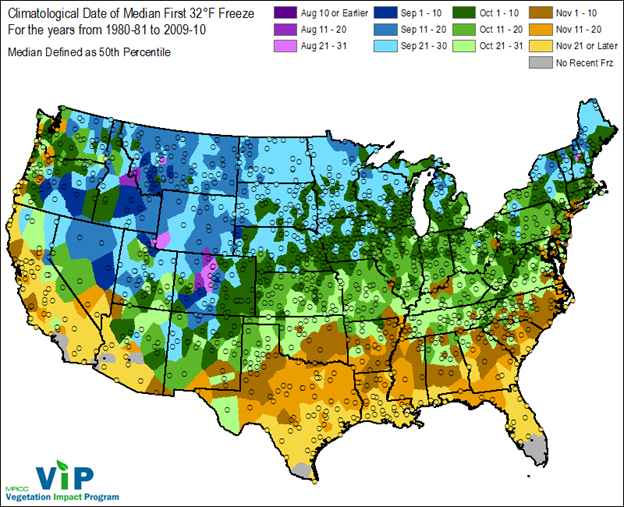
This data is typically collected and analyzed every ten years or so.  I’m not exactly sure when the last data was analyzed, but I did find some maps on the NWS referencing the period 1980/81- 2009/20 (below).  Therefore it is likely that new data will be released either this year or next year.

Temperature hardiness of common vegetables

Awareness of tolerance is especially important for vegetable crops, as the growing season and expected productivity of the plants.  The following chart is a general guideline, and your mileage may vary based on cultivar difference, microclimates, and other factors.  Also note that these temperatures are for both planting in spring and fall kill temperatures.  Some of the more tender plants, like tomatoes, may withstand colder temperatures when they’re mature so they may be less susceptible to frost at the end of the season vs. the beginning of the season. 

Season extension techniques, such as row covers can be used to protect tender plants in the spring and extend harvests in the fall.  Row covers can be selected by the degrees of protection they deliver.  For example, a row cover may offer 4 degrees of protection.  This allows the protected plant to withstand air temperatures 4 degrees colder that what it would unaided. For fall crops, note that plants may stop growing well before the kill temperature but will hang out in “stasis” until they are killed. The above NOAA chart provides probabilities for both spring and fall – allowing you to not only plan for spring planting but also for fall crops.  For scheduling fall crop planting dates, find your first frost date, count backwards the days to maturity (from the seed packet or tag), and add a few weeks for a harvest window and for the slowing growth as temperatures drop.

The Problem with Probability

These probabilities are based on past weather data, so keep in mind that these dates are used as a prediction not as a guarantee.  It is especially important to remember this as weather uncertainty increases with climate change.  Last frost could occur well before or even well after these predictive dates.  This also begs the question – which probability should you use?  Looking around at different sources, you might find sources that use either the 50% or 10% probability statistic, and there seems to be a bit of disagreement as to which one should be used.  Based on the data for my region, I’ve seen sources share both dates.  It really comes down to how much of a gamble you want to take or how much you want to push up harvest or maturity.  If you plant on the earlier 50% probability date you may end up having to cover the plants a few times to protect them from frost.  But each day that passes means that the chance of frost or freeze decreases.

Whenever I give a talk here at home in Omaha, I often ask my audience to guess what the average last frost date is for planting.  Invariably, the answer I get is Mother’s Day…which I guess works as a guidepost in general.  However, looking at the data (below), we can see that the 10% probability date for a 32 degree (killing) frost is May 4.  The light frost date is May 11 – plants may be damaged but not killed unless they’re very tender.  And the 50% probability date for a killing frost is actually April 21, which is the point where the probability of frost is 50% each day (and the probability shrinks each day.

Sometimes produce growers may opt to go early to get vegetables to market – which extends the sales season and allows them to charge a premium price if no other growers are selling.  Season extension techniques like high tunnels have also pushed back farm production dates.  As climate change makes weather more unpredictable, we may all be finding ways to alter the growing season as a norm rather than an exception.  Until then, we’ll rely on the data we have to make the best predictions.   

Sources:

https://www.canr.msu.edu/news/freeze_damage_in_fall_vegetables_identifying_and_preventing

http://www.gardening.cornell.edu/homegardening/scene0391.html

https://www.weather.gov/iwx/fallfrostinfo

https://www.ncdc.noaa.gov/cgi-bin/climatenormals/climatenormals.pl?directive=prod_select2&prodtype=CLIM2001&subrnum%2520to%2520Freeze/Frost%2520Data%2520from%2520the%2520U.S.%2520Climate%2520Normals

Spring vs. Fall planting: Where you stand depends on where you sit

I’m reviewing some literature while working on a proposal and ran across a paper by Lisa Richardson-Calfee, Roger Harris and Jody Fanelli at Virginia Tech on the effects planting date on sugar maple trees.  It’s not actually the topic of the proposal I’m working on but the paper caught my eye because spring versus fall planting is one of those questions that just never seems to go away.  In this particular study, balled-in-burlap trees planted at spring budbreak had more new root growth than trees planted in the fall.  So does this mean spring planting is better? Not necessarily.  For container-grown trees the results were basically a wash.  This is fairly typical.  I’ve not done an exhaustive search but I’ve looked at a fair number of studies of spring versus fall planting and they often show no clear trend or some will show spring coming out better or fall coming out better.

So why do we hear so often that “Fall is a great time to plant trees.”  Well, first off, think about who is saying it. Frequently it is nurseries that are looking to unload inventory that didn’t sell during the growing season or landscapers that are looking to keep crews busy during the slow fall season.  But the other part of whether fall is a good time to plant has to do with rainfall and temperature patterns.  Linda Chalker-Scott is an advocate of fall planting.  And for her location in western Washington – and many other locations in the West – this makes sense.  If we look at average rainfall patterns for Seattle (actually Linda is in Puyallup but no one outside of the Northwest can pronounce Puyallup), planting in October – when the rainy season is getting into full swing – makes much more sense than planting in April or May before the summer dry season.

Rainfall pattern for Seattle, WA Source: weather hannel.com

Where I live in East Lansing, on the hand, our climate has a summer maximum precipitation pattern – as does much of the Midwest.  As I’m fond of telling people, there’s a reason Michigan’s Arbor Day is the last Friday in April. Spring is a great time to plant trees here because soil temps are warming and the rainy season is just getting started.

Rainfall pattern for East Lansing, MI Source: weather hannel.com

What about fall planting in the Midwest? My take is that fall is an OK time to plant trees but not necessarily the best.  We typically will still have some rain in the fall but temperatures are declining quickly. Our average daily temperature in December is 28 deg. F, meaning our soils are beginning to freeze, while the average December temp in Seattle is a balmy 42 deg. F.  That’s warm enough for Linda’s roots to keep growing – well, actually not Linda’s roots but Linda’s tree’s roots.

In any event, if you live in Midwest and other places with a summer max. precipitation pattern, your state’s Arbor Day is a good guide to plant trees.  If you live out West in areas prone to summer drought then fall may be your best bet.  This is also a another example of why it’s good to get your landscape and garden advice from local sources rather than the ‘one-size-fits-all’ advice common in many magazines and gardening websites.


Richardson-Calfee, L.E, J.R. Harris, and J.K. Fanelli. 2008. Root and Shoot Growth Response of Balled-and-Burlapped and Pot-in-Pot Sugar Maple to Transplanting at Five Phenological Growth Stages J. Environ. Hort. 26(3):171–176.

Don’t need a weatherman to know which way the wind blows

Posted by Bert Cregg
Yesterday afternoon I did a little fall garage clean-up and listened to former MSU Extension colleague Dean Krauskopf’s call-in gardening show on the radio. A couple callers in a man phoned the show worried about his Japanese maple tree, which had a near-death experience from this past winter’s severe cold. The man had heard this coming winter was supposed to be just as bad as last winter and he wanted to know how best to protect his struggling tree from further calamity. Dean quizzed the caller for details about the tree and the site and gave some reasonable advice to try to modify the micro-environment around the tree to limit exposure to winter wind and cold. But I wondered where the caller got his information that winter 2015 was going to be as bad as 2014. As if anyone around here needs a reminder; January-March 2014in Michigan was the coldest since 1978 and the 4th coldest on record, with most locations reporting snowfall totals well above average. Many surrounding states has similar winter weather issues.

To get some insights on predictions for the upcoming winter, I consulted with the two most trusted sources of such information: The NOAA Climate Prediction Center and the Old Farmer’s Almanac.

The Climate Prediction Center maps present probabilities of colder or warmer than average weather for a given three month period. The most recent NOAA projections available on-line are predicting near-normal temperatures for January-March 2015 for most of the eastern half of the country, above average temps for the Northwest and below average for Texas and Florida. NOAA predicts below average precipitation for the lower Great Lakes and Northwest and above average precip for much of the South.

Current NOAA temperature predictions for Jan-March 2015

Current NOAA precipitation prediction for Jan-March 2015

Apparently, however, Dean’s caller is dismissing NOAA and all of their satellites and computer models and is relying on the Old Farmer’s Almanac instead for his long-term weather outlook. The Old Farmer’s Almanac is currently predicting colder and drier than normal for most of this upcoming winter for the lower Great Lakes.

Current temperature outlook for lower Great Lakes regions from Old Farmer's Almanac.
Current temperature outlook for lower Great Lakes regions from Old Farmer’s Almanac.

So, how much stock should we place in these predictions? Let’s step inside the Wayback Machine for a moment and see what each source was saying a year ago about the then-upcoming winter of 2014. NOAA and the computers are up first.

For most of the eastern U.S., NOAA predicted a warmer than average Jan-March 2014 with normal precip. Ooh, sorry about that NOAA but we thank you for playing ‘Guess that Winter’! Please be sure to pick up your parting gifts on your way to our Loser’s Lounge.

September 2013 map of NOAA prediction for Jan-March 2014 temperatures.

September 2013 map of NOAA predictions of Jan-March 2014 precipitation.

Next up is the Old Farmer’s Almanac, which predicts winter weather based on… well, no one’s quite sure. In any event, this time last year the Almanac predicted Jan-March 2014 would be mostly warmer and drier than normal for the lower Great Lakes. Oh no, bummer Almanac. Looks like you and NOAA can commiserate in our Loser’s Lounge. And that means Old Man Winter repeats once again as our champion!

Old Farmers Almanac September 2013 weather prediction for Nov. 2013-Oct. 2014.

So, what does all this mean for Winter 2015? Even with huge datasets and sophisticated models, long term weather projections are an iffy proposition. And, as much as everyone loves to say, “See, the Old Farmer’s Almanac was the only one to get it right”, there is little evidence that it does better than chance alone. Beyond that all we can say with certainty is that NOAA and the Computers would make a really cool name for a rock band.

How cold WAS it?

The line ‘How cold WAS it?’ has been a lead-in for stand-up comics for years; as in, “It was so cold politicians had their hands in their own pockets…” or “It was so cold the mice were playing ice hockey in the toilet bowl…” Like everyone, I’ve heard lots of discussion these days about just how cold this winter has been. We certainly know that this winter bucks a recent trend of relatively warm winters in the Midwest over the past two decades.
assets-climatecentral-org-images-uploads-news-TVMFrigidNights2014_detroit-1050x591

However a popular notion around these parts, especially among old-timers, is that “this is the way winters used to be…” I’m a relative newcomer to Michigan, currently experiencing my 15th winter here. This is, by far, the coldest winter since I’ve lived here. But could this simply reflect my lack of perspective as a newbie? To gain a little insight, I pulled the long-term weather data for Lansing, which dates back to the 1880’s. I compared the daily minimum temperatures from this winter with the long-term average low temperatures and daily record lows.

low temps 2013-14

The results will come as no surprise to anyone who lives east of the Rockies. It’s been cold. How cold WAS it? Certainly well below average, especially since the Holidays. As of yesterday, 41 of the last 52 daily lows have been below average and we have been below 0 deg. F 19 times. Despite the prolonged cold, we have not broken any daily records although locations near here have.

So, are the old timers right? Are we just getting a glimpse of the way things used to be back in the day? The data suggest they are probably experiencing a bit of selective memory. If you’ve lived here long enough you’ve seen a few winters this cold and even colder. But this January will go down as one of the 10 coldest (at least) on record, so the idea that winter’s weather is like the ‘old normal’ is a bit of a stretch.